|
Telecommunications as Economic Development The availability and use of telecommunications infrastructure will substantially impact the future economic vitality of the state. Telecommunications infrastructure is capital intensive, and fuels economic development by encouraging electronic commerce. Legal and regulatory access issues are and will continue to be examined by the Ventura administration so that barriers to affordable, high-quality telecommunications networks are removed. Public policy in this area should strive to allow interoperability of networks across legal jurisdictions, and remove barriers to competitive entry. Access to intrastate, national and international markets will be made achievable and economically feasible through a visionary communications structure that permits access to expanded opportunities in voice, data and video information transmitted instantaneously over high-speed networks, telephone lines and wireless communications systems to all parts of the state and the world. High technology start-ups and entrepreneurial ventures will be encouraged and supported by appropriate government actions, and development of a formal network of banking, legal, accounting and investment mentoring services. Every state resident, business and government office should have access to the network. A transition from the current noncompetitive regulatory environment to a consumer-oriented marketplace, with protections, is the best hope to make Minnesota a more attractive market for telecommunications infrastructure investment, and business in general.
The Big Accounting Initiative Score Number of telephone exchanges or wire centers where DSL is available. Telephone company compliance with applicable minimum retail service quality standards. Average prices of high-speed data services for rural and urban residential customers. Average price for plain old telephone service (POTS) for rural and urban residential customers. Additional telecommunications plant and equipment in service invested on an annual basis. |
||||||||||||||||||||||||||||||||||||||||||||||

|
||||||||||||||||||||||||||||||||||||||||||||||
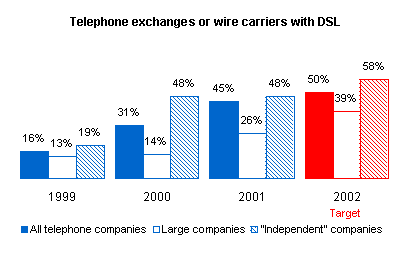
Number of telephone exchanges or wire centers where DSL is available. |
||||||||||||||||||||||||||||||||||||||||||||||
|
|
||||||||||||||||||||||||||||||||||||||||||||||
Note: Telephone companies provide high speed service primarily through digital subscriber line (DSL) technology. The availability of DSL service by exchange or wire center is an indicator of the level of availability of high speed service throughout the state. The Department of Commerce conducted statewide inventories of telephone exchanges asking whether DSL was available within each telephone exchange or wire center. (Some companies serve an entire exchange through a single "wire center" or central office. Larger companies may serve an exchange through a number of different wire centers.) Numbers are expected to improve due to agreements reached between the Department of Commerce and the Office of the Attorney General Residential Utilities Division and certain large telephone companies to further deploy DSL in telephone exchanges throughout the state. The Department of Commerce continues to work on the goal of making broadband service available to every state resident.
|
||||||||||||||||||||||||||||||||||||||||||||||
| top
|
||||||||||||||||||||||||||||||||||||||||||||||
Telephone company compliance with applicable minimum retail service quality standards. |
||||||||||||||||||||||||||||||||||||||||||||||
Click the underlined PASS or FAIL scores to read more about each company's compliance with Minnesota's telecommunications service standards.
Table Note: The Department of Commerce collects corporate performance data as part of its effort to encourage competition in the telecommunications industry. The information is not readily available. There is an approximate 18 month delay in receiving the data for this table.
Table Note: The Department of Commerce collects corporate performance data as part of its effort to encourage competition in the telecommunications industry. The information is not readily available. There is an approximate 18 month delay in receiving the data for this table.
Table Note: The Department of Commerce collects corporate performance data as part of its effort to encourage competition in the telecommunications industry. The information is not readily available. There is an approximate 18 month delay in receiving the data for this table. |
||||||||||||||||||||||||||||||||||||||||||||||
Note: "Held orders" are new primary line service orders not filled within 30 days after the customer submitted the request. The market for local telephone service continues to be dominated by monopoly, or near monopoly carriers. Without competition, there is no real incentive for a firm to provide high quality service to its customers. Regulation can play an important role in ensuring the benefits of competition. Historically, service quality has been problematic for larger telephone companies. The MDOC receives very few, if any, service quality complaints from smaller "independent" telephone companies. Because of the historical problems larger telephone companies have faced, these companies are subject to regulatory standards and reporting requirements that allow the state to monitor service quality, and remedy problems. The Ventura administration will continue to monitor the telephone industry to improve the level of service quality, and enforce minimum service quality standards. There are more standards for each company than those reflected in the tables. Standards are negotiated with each company and approved by the Public Utilities Commission. The Commerce Department and the Attorney General's Residential Utilities Division have worked to achieve uniformity in service quality standards and reporting procedures over the past two years. As a result, for 2001, three of the four largest phone companies (Frontier, Citizens and Qwest) all operate under similar standards, and are required to report service quality performance on at least an annual basis. |
||||||||||||||||||||||||||||||||||||||||||||||
| top
|
||||||||||||||||||||||||||||||||||||||||||||||
Average prices of high-speed data services for rural and urban residential customers. |
||||||||||||||||||||||||||||||||||||||||||||||
|
Pricing for DSL service
|
||||||||||||||||||||||||||||||||||||||||||||||
Note: The Ventura administration believes that accessibility to high-speed data services involves more than just the availability of the technology within an exchange. High- speed data service must be priced at a level which is affordable for the average consumer if is to be accessible to consumers. Information on pricing of high-speed data services will be helpful to public policy-makers in determining whether all state residents truly have access to this technology. Information regarding pricing of DSL service is difficult to obtain and to report. DSL prices vary by company based on the data speed provided, and whether Internet service is bundled with DSL service. According to the National Exchange Carriers Association (NECA) and the carriers, average prices for DSL did not change significantly between 1999 and 2000. The chart data represents average DSL prices reported by NECA and the carriers for 2000. The department will use this data as a benchmark for the future. Large companies tend to operate in urban markets, and small companies in rural markets. Therefore large and small company data is used as a proxy for urban and rural pricing. |
||||||||||||||||||||||||||||||||||||||||||||||
| top
|
||||||||||||||||||||||||||||||||||||||||||||||
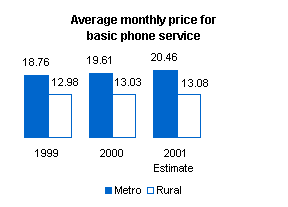
Average price for plain old telephone service (POTS) for rural and urban residential customers. |
||||||||||||||||||||||||||||||||||||||||||||||
|
|
|
|||||||||||||||||||||||||||||||||||||||||||||
Note: "Reasonably comparable" rates for rural and urban customers is a federal and state goal. People might assume that prices for such service are generally higher in rural areas because the costs of providing service are higher. Cost studies by the Commerce Department indicate that the cost of providing service to rural areas is higher than the cost of providing service in urban areas. However, rural telephone customers generally pay between 30 to 35 percent less for basic local phone service than do urban customers. The high costs of rural service are masked by "hidden" or "implicit" subsidies for all rural companies. The Ventura administration believes that if you want to achieve reasonably comparable rates, it is far preferable and efficient to use explicit cost-based subsidies for companies that actually demonstrate higher costs. However, only moderate progress has been made on a transformation to this kind of approach in Minnesota. The administration is focusing its efforts on the Minnesota Public Utilities Commission to address telecommunications reform issues. The administration will also be monitoring the average price increases for all telephone service in Minnesota, in comparison with overall national price trends. In 2000, the Producer Price Index for basic phone service actually declined 2.2 percent. Large companies tend to operate in urban markets, and small companies in rural markets. Therefore large and small company data is used as a proxy for urban and rural pricing. |
||||||||||||||||||||||||||||||||||||||||||||||
| top
|
||||||||||||||||||||||||||||||||||||||||||||||
|
|
||||||||||||||||||||||||||||||||||||||||||||||
Note: The Ventura administration intends to monitor and address cable service pricing in Minnesota. Comparable data is difficult to obtain from the various providers, in part because cable companies are regulated by local municipalities, not on a statewide basis. |
||||||||||||||||||||||||||||||||||||||||||||||
| top
|
||||||||||||||||||||||||||||||||||||||||||||||
Additional telecommunications plant and equipment in service invested on an annual basis. |
||||||||||||||||||||||||||||||||||||||||||||||
|
Annual investment in plant and equipment
|
||||||||||||||||||||||||||||||||||||||||||||||
Note: The level of investment by telecommunications companies is a general indicator of the competitiveness, or lack of competitiveness, in the market. Other factors contribute to investment levels, including the availability of capital, regulatory climate, tax policy and general economic conditions. The chart represents the gross plant investment by the telephone industry in 1999 and 2000. These figures have been broken down and the data aggregated into two categories: 1) the four largest phone companies: Qwest, Sprint, Frontier and Citizens Utilities (formerly GTE); and 2) all others. Investment by "small" or "independent" local phone companies did not increase at the same rate as investment by large telephone companies from 1999 to 2000, despite the large increase reported for the same time period in the deployment of DSL technology by "small" or "independent" phone companies. The Ventura administration will look deeper into this data in 2001 to try to reconcile these figures. The Ventura administration continues to believe that a competitive marketplace is still the best way to provide incentive for investment. The administration will continue to work to create a more competitive marketplace, and to maintain and improve the level of investment by the telecommunications industry in Minnesota in 2001. We do not have enough history with this measure to determine a target. However, we are working on a model to predict the level of telecommunications investment that should be expected, given the expansion or contraction of the state economy. |
||||||||||||||||||||||||||||||||||||||||||||||
| top
|
||||||||||||||||||||||||||||||||||||||||||||||
|
|
||||||||||||||||||||||||||||||||||||||||||||||
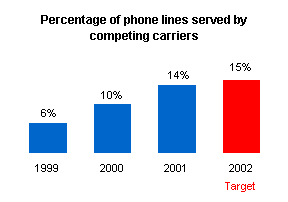
Note: One of the primary policy goals of the Ventura administration is to promote choice for consumers in the telecommunications marketplace. While there were over 3.4 million telephone lines in operation last year, only 14 percent were served by competing carriers. Expectations were set high when the Telecommunications Act of 1996 was enacted. Many thought the change would be more dramatic than it has been, and some have already dubbed the Act a failure. However, in retrospect, no one should have thought that transforming a 100-year-old monopoly into a competitive industry was going to be easy. The Ventura administration is proud of the progress that has been made as measured by a number of indicators. According to the FCC's last report on competition, Minnesota had the second highest penetration rate for competitors in the nation. But the work is far from over. The Ventura administration and future administrations will need to stay the course on telecommunications policy to ensure that the benefits promised by the 1996 Act are enjoyed by all. |
||||||||||||||||||||||||||||||||||||||||||||||
| top
|
||||||||||||||||||||||||||||||||||||||||||||||