


What were things like in 2002?
The following idicator summary is from the 2002 Minnesota Milestones and does not neccessarily reflect the current data trends.Indicator : Low-income school children
Rationale: Eligibility for free or reduced-price school meals is an important measure of child poverty trends, because it is updated every year.
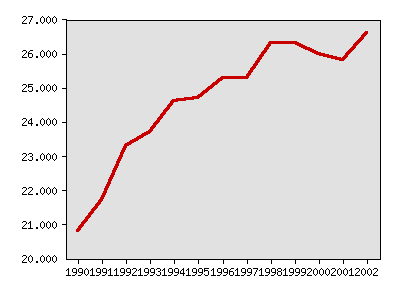
About this indicator: The proportion of public school children from low-income families approved for free or reduced-price meals rose from 20.8 percent in 1989-90 to 26.3 percent in 1998-99. After stabilizing between 25 and 26 percent between 1996 and 2000, it fell in 2001, but rose to 26.6 percent in 2002.
Students are eligible for free lunch when family income is below 130 percent of the federal poverty level. They qualify for reduced-price lunch and breakfast when family income is between 130 percent and 185 percent of the poverty level. In 2000-01, 18.2 percent of children qualified for free lunch and 7.5 percent qualified for reduced-price meals.
Not every eligible child participates. It is believed that a smaller proportion of eligible students sign up in the reduced-price category and also that secondary students are less likely to sign up. However, recent research from the U.S. Department of Agriculture indicates discrepancies in reported income, leading to the enrollment of ineligible children.
Percentage of public school children approved for free or reduced-price school meals
| Year | Data |
|---|---|
| Percentage of public school children approved for free or reduced-price school meals, Minnesota Department of Children, Families & Learning | |
| 1990 | 20.8% |
| 1991 | 21.7% |
| 1992 | 23.3% |
| 1993 | 23.7% |
| 1994 | 24.6% |
| 1995 | 24.7% |
| 1996 | 25.3% |
| 1997 | 25.3% |
| 1998 | 26.3% |
| 1999 | 26.3% |
| 2000 | 26.0% |
| 2001 | 25.8% |
| 2002 | 26.6% |
For comparison: Federal data is collected differently making comparison impossible.
Things to think about: The trend varies widely by school district. Low-income students are more highly concentrated in the Twin Cities area. Both St. Paul and Minneapolis school districts saw large increases in student poverty during the 1990s, an increase of 23 percentage points in St. Paul and 20 percentage points in Minneapolis, while increases in suburban areas were minimal.
Technical notes: The percentages shown are for all school children in kindergarten through twelfth grade enrolled on October 1 of each school year, who are eligible and sign up for the program. Poverty levels are adjusted each year and vary with the size of the family.
Sources:Minnesota Department of Children, Families & Learning, K-12 Economic Indicator Report, http://cfl.state.mn.us/
U.S. Department of Education, National Center for Education Statistics, www.nces.ed.gov Memorandum from Mathematica Policy Research to U.S.D.A., February 16, 2001
Related 2002 Milestones indicator:
Other related indicators:
- Number of children (and rate per 1,000) receiving welfare under the Minnesota Family Investment Plan. (Minnesota Department of Human Services, www.dhs.state.mn.us. County-level data available.)
Local data:
School district level data:
County level data:


Milestones is a product of the Minnesota State Demographic Center, a division of the Department of Administration