


What were things like in 2002?
The following idicator summary is from the 2002 Minnesota Milestones and does not neccessarily reflect the current data trends.Indicator : Food shelf use
In addition to local food shelf use, qualified people can participate in the national Commodity Supplemental Food Program, which provides food stamps and other food programs through national grants to states. In 2001, Minnesota agencies distributed over 4 million pounds of U.S. Department of Agriculture commodities worth over $3 million. The seven regional food banks distributed USDA commodity foods to approximately 300 food shelves and 900 on-site meal programs and shelters throughout the state.
| Year | Data |
|---|---|
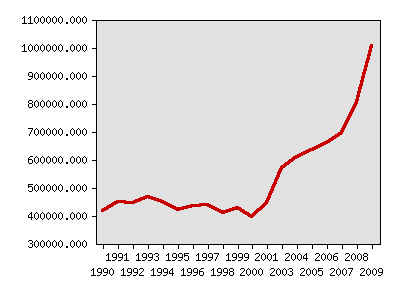
| Household visits to food shelves, Hunger Solutions Minnesota | |
| 1990 | 416,552 |
| 1991 | 449,232 |
| 1992 | 446,175 |
| 1993 | 465,977 |
| 1994 | 447,213 |
| 1995 | 421,369 |
| 1996 | 433,214 |
| 1997 | 435,881 |
| 1998 | 408,335 |
| 1999 | 425,583 |
| 2000 | 396,002 |
| 2001 | 443,939 |
| 2003 | 571,031 |
| 2004 | 609,730 |
| 2005 | 634,116 |
| 2006 | 660,476 |
| 2007 | 695,004 |
| 2008 | 805,207 |
| 2009 | 1,006,714 |
In Minnesota Milestones 1998, the source for data was The Urban Coalition, Minnesota Food Shelf Use Statistics. In 1999, the source was Hunger Solutions Minnesota.
The survey of household characteristics of food shelf users was conducted by Hunger Solutions Minnesota in July 2000. Participants of the confidential survey were clients of 18 on-site meal programs and 152 food shelves. This participation represented approximately 60 percent of all households served by these agencies.
- Minnesotans enrolled in MinnesotaCare, Medical Assistance and related health care programs (Minnesota Department of Human Services, www.dhs.state.mn.us)
- Minnesotans receiving government subsidies for child care (Minnesota Department of Children, Families & Learning, www.children.state.mn.us)


Milestones is a product of the Minnesota State Demographic Center, a division of the Department of Administration