


Indicator 49: Regional Disparity in Unemployment


Rationale: Differences in unemployment rates are a key indicator of variations in economic opportunity.
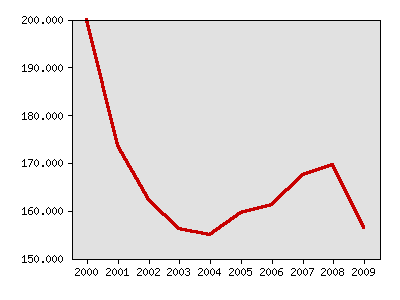
About this indicator: The ratio of the highest regional unemployment rate to the lowest rate declined from 2.00 in 2000 to 1.55 in 2004, then rose again. In 2009 the ratio of the highest to the lowest was 1.56.
The regions used are Economic Development Regions. There are 13 regions.
Highest regional unemployment rate as a percentage of lowest regional unemployment rate
| Year | Data |
|---|---|
| Highest regional unemployment rate as a percentage of lowest regional unemployment rate, Minnesota Department of Employment and Economic Development | |
| 2000 | 200% |
| 2001 | 173.5% |
| 2002 | 162.2% |
| 2003 | 156.1% |
| 2004 | 155% |
| 2005 | 159.5% |
| 2006 | 161.1% |
| 2007 | 167.5% |
| 2008 | 169.6% |
| 2009 | 156.3% |
For comparison: In November, 2010 Region 8 (Southwest) had the lowest unemployment rate at 5.0 percent. The highest unemployment rate was 9.4 percent in Region 5, the North Central Region. The state unemployment rate in November was 6.6 percent, with a seasonally adjusted rate of 7.1 percent.
Technical notes: This indicator uses annual average unemployment rates.
Sources:
- Minnesota Department of Employment and Economic Development, http://www.deed.state.mn.us/lmi/tools/laus/Default.aspx
Related 2002 Milestones indicator:
Local data:


Milestones is a product of the Minnesota State Demographic Center, a division of the Department of Administration