


Indicator 50: Income by Congressional District


Rationale: Variations in household income are an indicator of differences in living standards and economic opportunities across Minnesota.
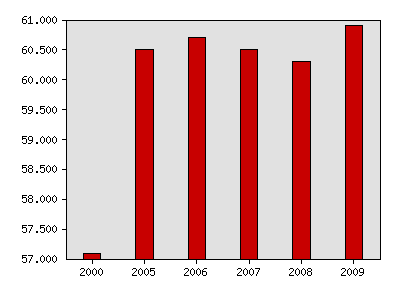
About this indicator: Congressional District incomes have become more equal in the 2000s, though disparities remain large. In 2000, the median income in the bottom-ranking district was 57 percent of the median in the top-ranking district. Between 2004 and 2009, the percentage fluctuated between 60 or 61 percent.
Lowest district median as a percentage of highest district median
| Year | Data |
|---|---|
| Lowest district median as a percentage of highest district median, U.S. Census Bureau | |
| 2000 | 57.1% |
| 2005 | 60.5% |
| 2006 | 60.7% |
| 2007 | 60.5% |
| 2008 | 60.3% |
| 2009 | 60.9% |
For comparison: Incomes are highest in the Second and Third Congressional Districts and lowest in the Seventh and Eighth Congressional Districts.
Things to think about: Increased equality among districts may be the result of low income growth in the wealthier areas, rather than high income growth in less affluent districts.
Technical notes: Data is for the 110th Congressional Districts. The 2000 Census presents data for both the 110th and 106th Congressional Districts.
Households include both families and nonfamily households Example of nonfamily households are people living alone and unmarried couples. Nonfamily households typically have lower incomes. The mix of household types by District is one factor affecting income.
Median income marks the midpoint of the distribution. Half of all households have incomes above the median and half are below the median.
Sources:
- www.census.gov http://factfinder.census.gov/home/saff/main.html
Local data:


Milestones is a product of the Minnesota State Demographic Center, a division of the Department of Administration