


What were things like in 2002?
The following idicator summary is from the 2002 Minnesota Milestones and does not neccessarily reflect the current data trends.Indicator : Parkland and open space
Rationale: The amount of land in parks and open space reflects the deliberate setting aside of land for outdoor recreation and enjoyment of natural areas.
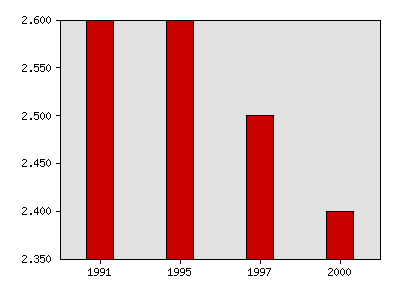
About this indicator: Parkland and open space increased, but did not keep pace with population growth. The amount of land in federal, state and regional parks, forests and wildlife refuges increased 1.8 percent, or by 213,000 acres, between 1991 and 2000. However, the number of acres per person declined from 2.6 in 1991 to 2.4 in 2000, an 8 percent drop. One implication of the state's population growing faster than public parks and open space is that existing facilities may become more crowded. Minnesota has 70 state parks and 57 state forests - one within 50 miles of any point in Minnesota.
Acres per person of federal, state and regional parks, forests and wildlife refuges
| Year | Data |
|---|---|
| Acres per person of federal, state and regional parks, forests and wildlife refuges, Minnesota Department of Natural Resources; U.S. Forest Service and Metropolitan Council | |
| 1991 | 2.6 |
| 1995 | 2.6 |
| 1997 | 2.5 |
| 2000 | 2.4 |
For comparison: Although state parks represent only a fraction of the land included in this indicator, Minnesota ranks eighth in the nation in acres of state parkland per capita. The top seven states are Alaska, Wyoming, Vermont, South Dakota, New Hampshire, Colorado and New Mexico.
Things to think about: State parks receive about 8.5 million visitors annually, with day use accounting for most of the visits. About 20 percent of these visitors come from outside the state, and nonresidents spend more money than residents. According to research by the Minnesota Department of Natural Resources, day visitors to state parks spend an average of $22 per day in nearby communities, and visitors who stay overnight spend about $28.50 per day. This translates into more than $196 million in visitor spending per year. According to the Minnesota Department of Trade and Economic Development, tourism of all kinds contributed $8.3 billion to the state's economy in 1999.
Technical notes: City, county and private parklands are not included in this indicator, except for those in the Twin Cities region (such as Como Park) that are designated as regional parks. Per capita figures may differ slightly from those reported in Minnesota Milestones 1998 due to changes in population estimates from the U.S. Census Bureau.
Sources:Minnesota Department of Natural Resources, www.dnr.state.mn.us
Metropolitan Council, www.metrocouncil.org
National Association of State Park Directors, www.indiana.edu/~naspd/
Minnesota Department of Trade and Economic Development, www.dted.state.mn.us
Related 2002 Milestones indicator:
Other related indicators:
- Number of public access sites on lakes and rivers (Minnesota Department of Natural Resources, Trails and Waterways Division, www.dnr.state.mn.us)
- Visits per person to state parks and Twin Cities regional parks (Minnesota Department of Natural Resources, www.dnr.state.mn.us; Metropolitan Council, www.metrocouncil.org)
- Number of boating, fishing and hunting licenses issued (Minnesota Department of Natural Resources, www.dnr.state.mn.us)
- Miles of state trails accessible to people with disabilities (Minnesota Department of Natural Resources, www.dnr.state.mn.us)
Local data:


Milestones is a product of the Minnesota State Demographic Center, a division of the Department of Administration