


What were things like in 2002?
The following idicator summary is from the 2002 Minnesota Milestones and does not neccessarily reflect the current data trends.Indicator : Urban air pollution
Rationale: Air pollution in the Twin Cities metropolitan area, Minnesota's most urbanized region, is one indicator of the state's air quality.
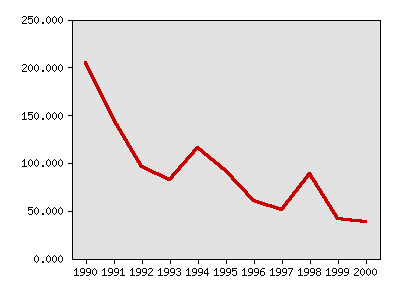
About this indicator: The Twin Cities area has seen dramatic improvement in the number of days above moderate levels for six monitored air pollutants. From 1990 to 2000, the frequency dropped from 205 days to 38 days, an 82 percent reduction. The six pollutants are carbon monoxide, nitrogen dioxide, sulfur dioxide, volatile organic compounds, lead and dust. This indicator is based on the Air Pollutant Standards Index developed by the U.S. Environmental Protection Agency to provide a simple, uniform way to report daily air pollution concentrations. It does not measure whether certain combinations of pollutants occur.
A downward trend in the six criteria pollutants suggests that regulation and pollution prevention efforts, including reduced emissions in newer cars, have produced significant gains in urban air quality, even while the state's economy and population have grown. Minnesota's vehicle emissions testing program, which ended in 1999, may also have contributed to the emissions reductions.
Days air pollution exceeds moderate levels in the Twin Cities
| Year | Data |
|---|---|
| Days air pollution exceeds moderate levels in the Twin Cities, Minnesota Pollution Control Agency | |
| 1990 | 205 |
| 1991 | 145 |
| 1992 | 96 |
| 1993 | 82 |
| 1994 | 116 |
| 1995 | 92 |
| 1996 | 60 |
| 1997 | 51 |
| 1998 | 88 |
| 1999 | 41 |
| 2000 | 38 |
For comparison: The U.S. Environmental Protection Agency collects national air quality data but uses a different method, making comparisons difficult. Air quality in the Twin Cities region is better than in many other urban areas in the United States. Minnesota's relatively flat terrain and exposure to rapidly moving weather systems allows wind to disperse and carry away air pollution. Also, industry is less concentrated here than in some U.S. cities.
Things to think about: Weather patterns can cause large variations in pollution levels in a single year. For example, hot, dry weather increased the levels of dust and ozone in 1994.
Hundreds of airborne chemicals remain unregulated, including most toxic chemicals and greenhouse gases such as carbon dioxide.
Technical notes: This indicator is based on data collected Monday through Friday in the Twin Cities metropolitan area. A moderate level of pollution is reported if any one of the six criteria pollutants exceeds half the federal standard. The data does not differentiate days when more than one pollutant reaches moderate levels from days when only one pollutant does. Data from the 1998 edition of Minnesota Milestones differ somewhat from data presented here because of revisions by the Minnesota Pollution Control Agency. In addition, the agency's reports formerly covered the state's four largest urban areas, but now cover all six of these pollutants only for the Twin Cities area. There are not enough monitoring stations in Rochester, St. Cloud and Duluth to calculate the Air Pollutant Standards Index in those cities.
Sources:Minnesota Pollution Control Agency, www.pca.state.mn.us
U.S. Environmental Protection Agency, www.epa.gov/oar/aqtrnd98
Metropolitan Council, www.metrocouncil.org/Region/ri104.htm
Related 2002 Milestones indicator:
- Growth in gross state product
- Employment of working-age population
- Energy efficiency of the economy
- Freeway congestion
- Energy use per person
- Renewable energy sources
- Vehicle miles
- Air pollutants
- Solid waste and recycling
- Toxic chemicals
- Water quality in lakes and rivers
- Wildlife habitat
- Changes in land use
Local data:


Milestones is a product of the Minnesota State Demographic Center, a division of the Department of Administration