


What were things like in 2002?
The following idicator summary is from the 2002 Minnesota Milestones and does not neccessarily reflect the current data trends.Indicator : Freeway congestion
Rationale: For the Twin Cities metropolitan area, commuting to and from work is an important quality of life factor. Congestion has many economic consequences including time lost and additional money spent on fuel.
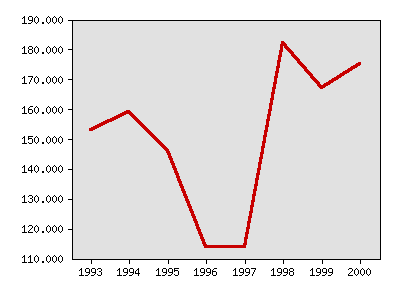
About this indicator: Rush hour freeway congestion has worsened since the mid-1990s. After falling to 114 congested miles in 1996 and 1997, the number of congested miles increased dramatically to 182 miles in 1998 and 175 miles in 2000. Congestion is defined as traffic slowing to less than 45 miles per hour for 15 minutes or longer. This indicator uses directional miles, so one mile of highway congested in two directions is counted as two miles. The total Twin Cities freeway system has approximately 500 directional miles.
Increased congestion is expected because few new roads and lanes are planned and the population in the Twin Cities will continue to increase. Transportation officials are likely to emphasize traffic management through such approaches as building light rail transit and providing special bus transit lanes.
Miles of Twin Cities area freeways that are congested during an average rush hour
| Year | Data |
|---|---|
| Miles of Twin Cities area freeways that are congested during an average rush hour, Minnesota Department of Transportation | |
| 1993 | 153 |
| 1994 | 159 |
| 1995 | 146 |
| 1996 | 114 |
| 1997 | 114 |
| 1998 | 182 |
| 1999 | 167 |
| 2000 | 175 |
For comparison: In 1999, the Twin Cities ranked 15th-worst in congestion as measured by the travel rate index computed by the Texas Transportation Institute. The travel rate index shows the time that congestion adds to a highway trip. Los Angeles was the worst ranked city in the country. Seattle, which is similar in size to the Twin Cities, ranked third worst, while Milwaukee and Buffalo, also similar in size, ranked much better at 30th and 59th, respectively.
Things to think about: Some of the costs of congestion are lost time, additional fuel cost, increased pollution and higher levels of stress. The Texas Transportation Institute estimated that in 1999, congestion cost Twin Cities drivers $670 per person. These costs include increased fuel usage and the lost value of time. They also concluded that each person used 61 gallons in excess fuel as a result of congestion.
Technical notes: The data and methodology used by the Texas Transportation Institute differ from that used by the Minnesota Department of Transportation. Data from Minnesota Milestones 2002 differs from Minnesota Milestones 1998 due to different methodologies used to determine congestion.
Sources:Minnesota Department of Transportation, Traffic Management Center, Metropolitan Division, www.dot.state.mn.us
Texas Transportation Institute, The 2001 Urban Mobility Report, May 2001, http://mobility.tamu.edu/
Local data:


Milestones is a product of the Minnesota State Demographic Center, a division of the Department of Administration