 |
DEPARTMENT RESULTS |
|
|
|
|
|
Goal: Safeguard what exists |
Policies:
-Preserve essential elements of existing transportation systems
-Effectively manage the operation of existing transportation systems to
provide maximum service to customers
|
|
Why is this goal
important?
Transportation systems support all aspects of Minnesota’s economy and
quality of life. Mn/DOT’s first goal is to preserve Minnesota’s
transportation assets in sound condition and preserve maximum traffic flow
on our current systems. This means obtaining the greatest productivity at
the best cost. Mn/DOT has a dozen measures in its
20-year Statewide Plan
to track progress on this goal.
Five measures
are shown here.
Measures - Pavement Ride Quality and Bridge Condition
Transportation infrastructure faces constant deterioration
due to heavy use, age and weather. Mn/DOT regularly monitors and measures
the physical condition of pavements and bridges.
Pavement measures include both the smoothness of ride provided to travelers
– the Customer Ride Quality Index, and the integrity of the pavement
structure – its years of Remaining Service Life. Ride Quality is of primary
importance to travelers. Keeping pavement service life at a sound level is
important to taxpayers. Good
preventative maintenance minimizes life cycle costs by avoiding having to
prematurely rebuild roads.
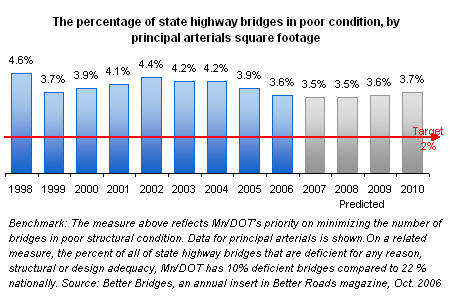
Similarly, if too many bridges deteriorate to Fair condition, or Poor
condition ("structurally deficient"), the costs of repair and replacement
rise disproportionately. If allowed to deteriorate to the point where they
have weight restrictions, it imposes costs on freight and agricultural
haulers. There are 2,504 highway bridges 20 feet or longer on state highway
principal arterial routes and 3,581 on the entire state system.
What is Mn/DOT
doing to achieve the goal?
Preserving pavement and bridges is Mn/DOT’s highest statewide
priority for investment. Mn/DOT aims to minimize
the share of pavement and bridges in “Poor” condition. Once they
fall to the “Poor” level, costly and sometimes premature replacement
may be necessary. Mn/DOT
conducts regular inspection and cost-effective preventative
maintenance to extend pavement and bridge life.
Mn/DOT replaces or rehabilitates about 1,100
miles of pavement annually. Pavement engineers identify the most
cost-effective treatment for every segment of road to help achieve
the twin objectives of smooth ride and maximum service life. Targets
have been set to increase preventative maintenance, such as
crack-filling.
Beginning in 2006, new resources were put
into Bridge Preventative Maintenance activities to extend bridge
life. Mn/DOT replaces an
average of 25 bridges and repairs about 50 bridges each year. Since
2002, MN/DOT has substantially increased its level of bridge
spending for repair, improvements and replacement.
While preservation of the system is Mn/DOT’s
highest priority, tradeoff decisions must be made to balance the
needs of preserving pavements and bridges, improving safety, addressing rising
congestion, and improving interregional travel times. 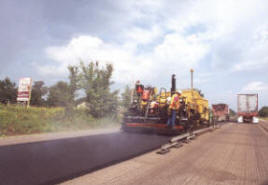
What is Mn/DOT's
progress?
Through 2002, state highway pavements
on Principal Arterials regularly exceeded desired targets for a
"Good" quality smooth ride. The share rated "Good" began falling in
2001 and dropped below the target of 70 percent for the
first time in 2003 and 2004. Pavement in "Good" condition improved
from 63% in 2004 to 69% in 2006. It is projected to meet the
70% target again in 2007. The share with a
"Poor" ride increased slightly above the 2 percent target in 2003
through 2006. It is expected to improve to 1.5% in 2007, but then
deteriorate significantly from 2007 to 2010.
In 2006, the percentage of bridges on Principal
Arterials in “Poor” structural condition improved from 3.9
to 3.6 percent, the best level in 10 years. The 20-year target is to reduce
"Poor"
bridges to 2 percent. Minnesota has an aging stock of bridges built in
the interstate era. In 2006, the number of bridges in “Good” condition
improved to 54%, just short of the 55% target. Principal Arterial
bridges are 85% (by deck area) of the state bridges.

Measure - Customer
Satisfaction with Maintenance
The primary goal of Mn/DOT maintenance operations
is to provide safe and efficient travel for Minnesotans. Customers
have reaffirmed the importance of maintenance through periodic
surveys. Mn/DOT uses an annual statewide survey of Minnesota drivers
to measure any changes in their view of roadway maintenance performance. The survey reflects
satisfaction with snow and ice removal, road smoothness, visibility
of pavement
markings, signage and roadsides.
What is Mn/DOT doing to achieve the goal?
Mn/DOT’s maintenance engineers are regularly working on
new, more cost-effective approaches to keep traffic flowing,
ensure safety, and meet customer expectations. Research and best
practices contribute to innovations in striping, snow and ice
removal, pavement patching and other services.
What is Mn/DOT’s progress?
Since maintenance competes for limited funds with
other needs, Mn/DOT’s objective is to maintain satisfaction at a
“Good” level, defined as 7 on a scale of 1 to 10. The public’s
rating of Mn/DOT’s overall maintenance level on a 10-point
scale, scored a 6.2 in 2006 – "above-average". Research has found
satisfaction with maintenance to be tied to satisfaction with
pavement condition and pothole repair. Mn/DOT allocated more
than $4 million in additional funds annually to pothole patching in
2006 and 2007.
Measure - Snow
and Ice Removal.
The safety of Minnesota’s traveling public is the
primary goal of Mn/DOT’s snow and ice removal operations. Citizens have
reaffirmed the importance of safe trips and snow and ice removal in
customer surveys. Mn/DOT continuously seeks new and better
methods for snow and ice removal and it is important to gauge their success
using the established measures and targets. Mn/DOT's performance measure is the time it
takes to achieve bare lanes on state highways after the end of each snow and
ice event. Mn/DOT groups roads into five classifications based on
traffic levels. Each classification has a specific performance target.
What is Mn/DOT doing to achieve the goal?
Mn/DOT uses a variety of money-saving technologies to monitor roadway
conditions, prevent ice and snow build-up, and remove snow and ice. Snow and
ice managers strive to find the right balance between resources and
technology to work toward meeting performance targets. Performance is based
on the length of time it takes to reach bare lanes at
various traffic volume levels.
What is Mn/DOT's progress?
Mn/DOT achieved its overall statewide snow and ice removal targets for
the last nine winters, from 1998-99 through 2006-07. However, the
conditions of each specific snowstorm may vary. Weather conditions such as
air and ground temperatures and time and length of snowfall greatly affect Mn/DOT's ability to meet the targets for each storm. The annual data is an
average of storms and routes statewide for the entire season. The lowest
average was in the relatively mild winter of 2002-03.
For the 2006-07 winter, on average, all districts
were on target and statewide performance was better than the winter before.
Spending was lower than last winter. |
| |
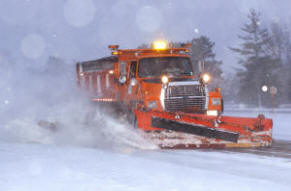 |
Snow & Ice Removal
Hours to bare lane
Green = desired target range
(All road classifications averaged together) |
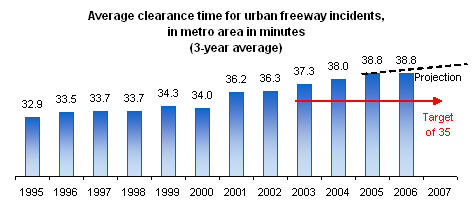
Measure- Clearance Time for Urban Freeway
Incidents
It is important to preserve the full traffic
capacity of highways by minimizing disruptions. According to federal
estimates, crashes and other incidents, weather, construction, and
maintenance activities cause more than half of all driver delays, on
average. Reducing these types of delays can be done in the
short-term with moderate levels of resources, while construction
projects to expand capacity are costly and take years to complete.
Mn/DOT measures incident
clearance time on the Twin Cities freeway system between
6:00 AM and 7:00 PM on weekdays. About 9,000 incidents were
identified in 2006, 7,482 crashes and 1,517 blocking stalls. A rule of thumb is that for every minute
a lane of traffic is blocked, four minutes of congestion are
created.
What is Mn/DOT
doing to achieve this goal?
Mn/DOT works with the State
Patrol, local police, towing companies and other
emergency responders to improve methods for speedy clearance of incidents
from freeways in the Twin Cities Metro Area. Mn/DOT
also pursues new laws to allow quick clearance. Speed of response is affected by the number of state
troopers assigned to the Metro Area. There were 120
troopers assigned to station duty in the Metro in
2006, up from 113 in 2004. Tools used to improve
traffic flow include ramp meters; video cameras to
detect incidents; automated data collection; and the
FIRST – Freeway Incident Response Safety Team, Mn/DOT’s
roving patrol. Three additional FIRST routes
were added in 2005 and 2006 to speed incident
clearance on 95 more miles of the Metro freeway
system. More training was provided for responders
and new software put in State Patrol cars.
Also, television, web sites, radio and
message signs are used to give travelers information
to keep moving during incidents or storms. Mn/DOT
works to minimize road closures and detours for
highway projects, and provides contractor incentives
for early completion.
What is Mn/DOT's
progress?
In 2006 Mn/DOT stabilized the
average time for clearing incidents
on Metro freeways at 38.8 minutes. The target is 35 minutes.
Increasing traffic volumes and crashes tend
to continue to push clearance time upward, but new strategies and expanded FIRST
patrols may be able to keep clearance times from
increasing in the near future.
|
|
Learn more at:
 View Minnesota's Statewide Transportation Plan and all of its
performance measures:
www.oim.dot.state.mn.us/StatePlan/index.html
View Minnesota's Statewide Transportation Plan and all of its
performance measures:
www.oim.dot.state.mn.us/StatePlan/index.html
To see a list of current Twin Cities Metro freeway incidents, click on:
www.dot.state.mn.us/tmc/trafficinfo/metrocams/incidents.html
For more information on how incidents disrupt traffic and on activities to
reduce their impact, click on:
http://www.dot.state.mn.us/tmc/incmgmt.html
To get current information on construction projects and travel conditions by
region, click on:
www.511mn.org
|
|
Goal: Make the
transportation network operate better |
|
Policies:
-Enhance mobility in Interregional Corridors linking Regional Trade Centers
-Enhance mobility within major Regional Trade Centers
-Increase the safety and security of transportation systems and their users
-Provide cost-effective transportation options for people and freight |
|
Why is this goal
important?
Reasonable and reliable travel times between Regional Centers and within
Minnesota’s metropolitan areas are vital to travelers and shippers.
Providing safe and efficient connections will ensure competitive access to
markets and services and good connections to tourist and recreational areas.
Options to automobile travel are essential to those who cannot drive, and
these options can contribute to reducing congestion. Mn/DOT supports
transitways, bus travel on highway shoulders, park and ride, telecommuting,
biking, and other methods of reducing demand on highways. There are 19 measures for this goal in the
20-year Statewide Transportation Plan. Six measures are covered here.
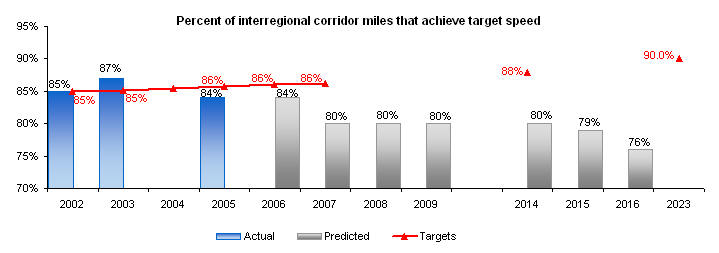
Measure: Travel Speed on Interregional Corridors (IRCs).
The IRC system includes about 3,000
Interstate and State highway miles connecting the fifty largest Regional
Centers in Minnesota with each other and neighboring states. High-Priority IRCs connect the Twin Cities with the largest out-state centers, such as St.
Cloud, Duluth, Rochester, and Fargo-Moorhead. The performance target for
these routes is an average speed of 60 mph for a typical trip of an hour or
more. Medium-Priority IRCs connect medium-size centers to the Twin Cities
and other Regional Centers, and have a performance target of an average
speed of 55 mph for a typical trip of an hour or more.
What is Mn/DOT doing
to achieve the goal?
Preservation of pavements and bridges is the highest priority, but
Mn/DOT is making investments in selected segments of the IRC system to achieve or maintain the travel speed targets of
55 mph and 60 mph. In addition, corridors are being actively managed with
local community participation to address safety concerns and minimize the
effects on travel speed of access points, local road connections, and
development.
What is Mn/DOT’s
progress?
Mn/DOT’s 20-year plan established a target of 90 percent of the IRC system
meeting corridor target speeds by the year 2023. Currently 84 percent of the system meets target, down from 87% in 2003.
Performance gains from recent construction projects are being outweighed by
performance declines on some corridors with growing traffic volumes.
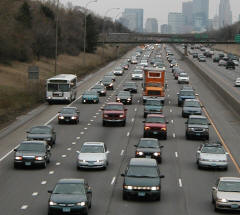
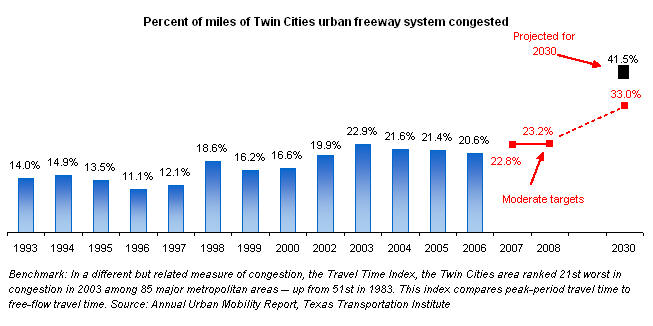
Measure: Twin Cities Urban Freeway Congestion.
Congestion plays an increasing role in
the daily lives of people who live and work in the Twin Cities area, and is
beginning to affect other large Regional Centers. Mitigating congestion
affects safety, economic vitality, air quality and the quality of life. For
the Twin Cities Urban Freeway System, Mn/DOT monitors travel speed
constantly on most routes. Annually, it measures the percentage of the 324
mile system that is congested on an average weekday rush hour. Congestion is
defined as traffic that falls below 45 mph in weekday peak periods (6 to 9
am and 2 to 7 pm).
What is Mn/DOT doing to achieve the goal?
Methods of mitigating freeway
congestion include relieving bottlenecks, adding highway lanes, developing
cost-effective transit options, I-394 MnPass, incident clearance, tra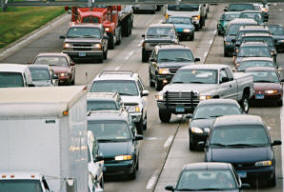 veler
information signs and services, managing demand, and other effective traffic
management. Based on current funding projections, some $3 billion is
anticipated over the next 25 years to expand and reconstruct portions of the
Twin Cities area highway system.
Bottleneck relief and lane expansion
projects are targeted to the highest priority locations. They will relieve congestion in project areas, but overall
system relief will be less noticeable. veler
information signs and services, managing demand, and other effective traffic
management. Based on current funding projections, some $3 billion is
anticipated over the next 25 years to expand and reconstruct portions of the
Twin Cities area highway system.
Bottleneck relief and lane expansion
projects are targeted to the highest priority locations. They will relieve congestion in project areas, but overall
system relief will be less noticeable.
What is Mn/DOT's Progress?
Miles congested on the Twin Cities Urban Freeway System during rush-hour
peak periods dropped for the third straight year in 2006, to 20.6
percent. Recent construction projects contributed to the gains, meeting Mn/DOT’s
target to contain congestion growth. Because of finite resources and the exceptional
growth in Minnesota's economy and population, current efforts can
temporarily retard the
growth of congestion but not reverse it.
|
 |
Measure: Bond Accelerated Construction Projects
What is Mn/DOT doing to achieve this goal?
The 2003 legislature provided $400 million in highway bonds enabling the
state to leverage over
$400 million in advance federal funds for 2004-07. This funding allowed the state to accelerate eleven construction projects by a combined
total of 60 years. These Bond
Accelerated projects are expected to improve the performance of selected Interregional Corridors and
to moderate congestion
growth in the Twin Cities area. Mn/DOT met its goal to let the projects
on or very close to schedule.
What is Mn/DOT's progress?
Projects under construction are an interchange on Highway 52 in Oronoco
north of Rochester, four interchanges on TH 101 between Rogers and Elk
River, and the "Unweave the Weave" rebuild at I-694 and I-35E in
Vadnais Heights,
TH 34 through Park Rapids and TH 10 through Detroit Lakes.
For project information
see:
www.dot.state.mn.us/financing/
 |
|
Learn more at:
To view current congestion levels on the Twin Cities freeway system click
on:
http://www.dot.state.mn.us/tmc/trafficinfo/map/refreshmap.html
To see a map of Minnesota’s Interregional Corridors click on:
http://www.oim.dot.state.mn.us/irc.html
To view the Metropolitan Council Transit website, click on:
http://www.metrocouncil.org/transit/
For information on Greater Minnesota transit service click on:
http://www.dot.state.mn.us/transit/transitreports/05/index.html
To see the statewide transit plan click on:
http://www.dot.state.mn.us/transit/research/index.html
|
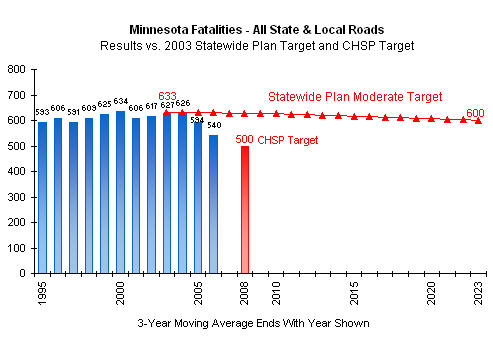
Measure: Fatalities on Minnesota Roads
Why is this important?
Mn/DOT measures the number of fatalities on all Minnesota state and
local roads and makes it a high priority to reduce fatalities and severe
injuries. The National Safety Council (NSC) reports that nationally, crashes are
the leading cause of death among persons aged 1 to 34, and the fifth leading
cause of death among all persons. The cost of one death is estimated by the
National Safety Council to be $1,120,000.
What is Mn/DOT doing to achieve the goal?
Mn/DOT and the Minnesota Department of Public Safety have established a
Comprehensive Highway Safety Plan (CHSP) in partnership with local
governments and the private sector. It has aggressive goals for reducing
life-changing injuries and reducing fatalities to 500 by 2008. To accomplish
this goal the disciplines of Engineering, Enforcement, Education and
Emergency Services are working together. Numerous plan strategies are now
underway. Mn/DOT is continuing a Speed Management Project aimed at
preventing excessive speeds by better enforcing existing limits and raising
limits where appropriate. Also, the top 350 High Crash Locations are a
focus of state highway safety improvements. To prevent cross-median crashes,
cable median barriers have been
installed on 36 miles of high incident locations, such as on I94 northwest of
Minneapolis to St. Cloud, and on I494 and TH 169. 53 more miles of cable
median barrier are planned and funded as of June 2007.
What is Mn/DOT's progress?
Fatalities dropped sharply in 2006 for the third straight year, to 494, meeting the target for 2008 two years in advance.
Fatalities were the lowest since 1945. The 3-year average fatalities were
reduced from 594 in 2005 to 540 in 2006, as shown in the graph. This makes Minnesota’s fatality rate (per vehicle miles driven) the
fourth lowest
in the nation.
|
|
Learn more at:
To see Public Safety's Crash Facts click on:
http://www.dps.state.mn.us/OTS/crashdata/crash_facts.asp
Department of Public Safety home page:
www.dps.state.mn.us
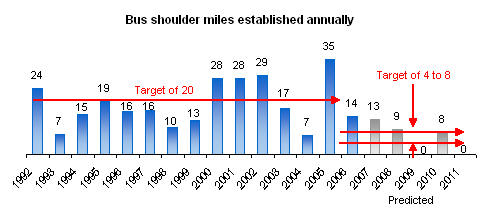
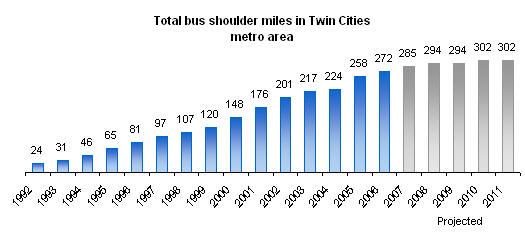
Measure: Bus Shoulder Miles Established
Both Mn/DOT’s Strategic Plan and the Metropolitan Council’s
Regional Framework focus future investments on improving travel time and
reliability on highly-traveled metro corridors. They support cost-effective
multimodal transportation choices. The goal is to move the most people
through the congestion. “Transit Advantages” such as bus-only
shoulders, park and rides and HOV (High-Occupancy Vehicle) bypasses, are an important tool authorized in Minnesota law to speed bus
travel time on congested roadways, improve bus reliability, and draw more
automobile drivers into buses. From 6 to 250 registered buses use each
bus-shoulder route each workday. They can divert to authorized shoulders when mainline
speeds drop to below 35 mph, but cannot exceed 35 mph on the shoulder. The highest volume corridor, I-35W South of Minneapolis, has 250 buses per
day in each direction.
As the nation's bus shoulder network leader, available, cost-effective,
opportunities are nearly all built. Limited expansion will continue. In the
future "Transit Advantages" emphasis will shift to building more park and
ride lots and preserving existing bus shoulders.
What is Mn/DOT doing to achieve
the goal?
Within the Twin Cities area, Mn/DOT and the Metropolitan Council are
expanding bus-only shoulders to allow commuter buses to bypass congestion.
Through 2006, over 270 miles of strengthened bus shoulders have been
established. Twenty-two more miles are planned for 2007 and 2008.
What is Mn/DOT's progress?
Bus-only shoulders were built at an average rate near or exceeding Mn/DOT’s
target of 20 miles per year through 2005. Using the infusion of Bond
funding, thirty five new miles were added in 2005 and 14 miles in 2006. Because a majority of the most affordable and productive locations
have been developed, the target was lowered to 4 to 8 miles per year
starting in 2006. Bus-only shoulders provide significant improvements in
transit speed - from 5 to 20 minutes savings per trip. In a survey of
riders, 89 percent said bus-shoulders saved them time on a typical morning.
|
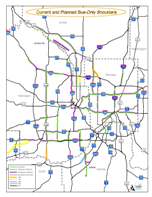
Click here for a bus shoulder map |
 |
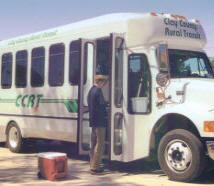
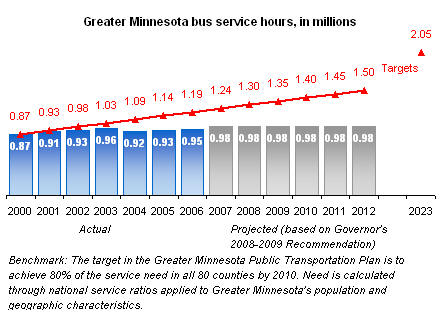
Measure: Greater Minnesota Bus Service Hours
As Minnesota's population ages and absorbs more transit-dependent immigrants, non-auto
travel options become more important to enable people to get to work,
school, family, medical services and shopping. For 80 Greater Minnesota
counties, Mn/DOT measures the total bus service hours provided versus the
level of service necessary to meet estimated passenger demand, based on the
demographics of the counties. What is Mn/DOT
doing to achieve the goal?
In Greater Minnesota, Mn/DOT contributes funds to local agencies for
development and operation of transit systems. Mn/DOT is continuing to assist
transit systems in improving efficiency to make resources available for
service delivery. What is Mn/DOT's progress?
Sixty-seven percent of estimated need for bus service was provided in
Greater Minnesota in 2000 – some 870,000 hours of service. The long-term
target set in the Greater Minnesota Transportation Plan is to meet 80
percent of need in all 80 Greater Minnesota counties by 2010 – 1,400,000
hours of service. Bus service hours increased in 2006 to 950,000. In
November 2006 Minnesota citizens approved a constitutional amendment that
dedicates Motor Vehicle Sales Tax (MVST) dollars to transit and highways.
The Governor’s 2008-2009 Biennial Budget Recommendation allocates sufficient
funding to provide 980,000 annual bus service hours for Greater Minnesota
through 2012.
|
|
|
|
Goal:
Make Mn/DOT work better |
|
Policy:
-Continually improve Mn/DOT’s internal management and program delivery
|
|
Why is this goal
important?
An objective in Mn/DOT’s Strategic Plan is “Building Faster.” This means
developing and building transportation projects in less time. It also means
delivering projects on the schedule announced to affected communities,
contractors and travelers.
Mn/DOT is also committed to “continuously improve service and efficiency in
order to give citizens the best value for their tax dollar.” Strategies
include expanding E-government services, greater use of design-build
construction, competitive sourcing of services, and other innovations. The
objective is to free up resources to shift to construction projects.
Numerous measures of quality, cost and time efficiency are used throughout
Mn/DOT. They include management of construction projects, contracts,
facilities, fleet, information technology and human resources, to name a
few. Two examples are covered here.
Measure: Construction Projects on Schedule
Putting a project out for bid is
the key step toward beginning construction after completing planning,
design, permits, and land acquisition. To provide accountability to the
public, and its partners - construction firms and local governments - Mn/DOT
measures the percentage of its projects planned for the current year of its
construction program that are actually put out for bid, or “let,” in the
year. It uses additional measures to keep projects on schedule in real-time
and evaluate cost deviation.
What is Mn/DOT doing
to achieve the goal?
Over the last several years Mn/DOT
has engaged in several major process redesign initiatives to reduce steps in
the development of transportation projects and put more accountability and
resources in the districts, where the projects are delivered.
What is Mn/DOT’s
progress?
Mn/DOT’s target is to put at least 90 percent of scheduled current-year projects out for bid. In 2006 out of
135 construction projects
scheduled, 86 percent were put out for bid during the year. Because of the many variables - such as fluctuating funding, municipal
approvals, permits, right-of-way acquistion - the 90 percent target is a
challenging one.
|
|
Measure -
Electronic Government Services
Electronic Government Services (EGS) are government activities that take
place over electronic communications technology, such as the Internet.
As more citizens become proficient with technology,
expectations grow. Mn/DOT customers and partners want to conduct business
electronically in order to reduce the need to travel, and to have expanded
hours of service.
The 3 categories of external electronic services and some examples are:
Government to Citizen. Traveler information on road conditions and
freeway camera images on the Internet to help citizens plan their trips.
Information on the location and status of construction projects.
Government to Business. Electronic bidding on transportation
projects. Online applications for motor carrier permits and aircraft
registration.
Government to Government. Electronic transactions with local, state
and the federal government to reduce manual processing. Sharing financial
data, construction project data, road plans, maps, manuals and forms with
federal and local governments.
The Governor's Strategic Plan promotes EGS as a way to
transform government and improve public services. To monitor progress, Mn/DOT
measures the number of services that are delivered electronically versus the
targeted number.
What is Mn/DOT doing to achieve the goal?
Mn/DOT offers a wide variety of electronic services to external customers
through websites and electronic transactions, as well as internal services
that help employees perform their jobs more effectively. Typically a dozen
or more projects are underway that result in new or improved E-government
services.
What is Mn/DOT 's progress?
In 2006 Mn/DOT exceeded performance targets with 76% of
Government to Citizen, 74% of Government to Business, and 76% of Government
to Government services delivered electronically versus potential.
|
 |
 |
 |
|
Last update on
07/31/2007
|
|