


What were things like in 2002?
The following idicator summary is from the 2002 Minnesota Milestones and does not neccessarily reflect the current data trends.Indicator : Vehicle miles
Rationale: Trends in motor vehicle use give an indication of pressures on the environment, particularly through air and water pollution and global climate change.
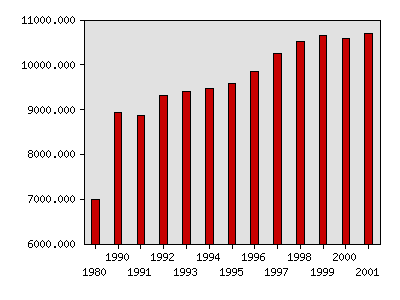
About this indicator: Vehicle miles traveled per person have risen nearly every year in the past two decades, up 53 percent between 1980 and 2001. This includes all personal, public, and commercial traffic. Vehicle miles rose 33 percent between 1990 and 2000, while Minnesota's population increased by 12 percent.
The potential costs of increases in vehicle miles include road congestion, which wastes time and fuel; higher private costs of car ownership; and higher public costs to maintain roads and bridges and to build new ones. To the extent that Minnesota vehicles continue to rely on fossil fuels, increased driving also harms the environment.
Vehicle miles traveled per person
| Year | Data |
|---|---|
| Vehicle miles traveled per person, Minnesota Department of Transportation | |
| 1980 | 6,992.2 |
| 1990 | 8,938.7 |
| 1991 | 8,876.8 |
| 1992 | 9,322.4 |
| 1993 | 9,393.2 |
| 1994 | 9,474.9 |
| 1995 | 9,579.4 |
| 1996 | 9,858.8 |
| 1997 | 10,258.8 |
| 1998 | 10,517.8 |
| 1999 | 10,651.7 |
| 2000 | 10,593.5 |
| 2001 | 10,706.1 |
For comparison: Between 1995 and 2000, the national rate of vehicle miles traveled per person increased from 9,202 to 9,870, an increase of 7 percent. Minnesota's rate rose 10.6 percent during the same time period, from 9,579 to 10,594.
Things to think about: The Minnesota Department of Transportation estimates that congestion costs the Twin Cities metropolitan region $1 billion a year. A perpetual rise in miles traveled also reduces the time available for other things, such as work, family life, and community activities. In addition, more than 50 percent of toxic air emissions in Minnesota come from motor vehicles, and the carbon dioxide generated by vehicles is a key factor in global climate change.
Technical notes: The Minnesota Department of Transportation estimates vehicle miles from traffic data collected at 8,000 sites across the state. Some numbers in this edition of Minnesota Milestones differ from past versions due to revised data from the U.S. Department of Transportation and the U.S. Census Bureau.
Sources:University of Minnesota Center for Transportation Studies, Congestion in the Twin Cities: Who's Paying the Price? A Summary Report, November 2000: www.cts.umn.edu/pdf/ValuePricing.pdf
Minnesota Department of Transportation, Office of Investment Management: www.mndot.state.mn.us
Minnesota Pollution Control Agency, Air Quality in Minnesota: Problems and Approaches, January 2001: www.pca.state.mn.us
U.S. Department of Transportation, Federal Highway Administration, Highway Statistics 1999, Functional System Travel 1999
Related 2002 Milestones indicator:
Local data:
County level data:


Milestones is a product of the Minnesota State Demographic Center, a division of the Department of Administration