


What were things like in 2002?
The following idicator summary is from the 2002 Minnesota Milestones and does not neccessarily reflect the current data trends.Custom Report:
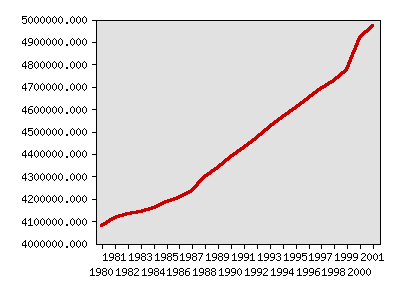
State and county population, total
| Year | Data |
|---|---|
| State and county population, total, U.S. Bureau of the Census | |
| 1980 | 4,075,970 |
| 1981 | 4,111,728 |
| 1982 | 4,131,450 |
| 1983 | 4,141,456 |
| 1984 | 4,157,706 |
| 1985 | 4,184,302 |
| 1986 | 4,205,212 |
| 1987 | 4,235,136 |
| 1988 | 4,296,166 |
| 1989 | 4,338,057 |
| 1990 | 4,387,283 |
| 1991 | 4,427,429 |
| 1992 | 4,471,503 |
| 1993 | 4,521,709 |
| 1994 | 4,566,028 |
| 1995 | 4,605,445 |
| 1996 | 4,647,723 |
| 1997 | 4,687,726 |
| 1998 | 4,726,411 |
| 1999 | 4,775,508 |
| 2000 | 4,919,479 |
| 2001 | 4,972,294 |


Milestones is a product of the Minnesota State Demographic Center, a division of the Department of Administration