|
Growing Smart in Minnesota Recognizing that growth will occur, communities should be shaped by choice, not by chance. “Smart growth” principles force tough choices about how we will grow and how the state’s resources will be used. It’s a mindset about incentives, not mandates. Minnesota’s resources should be focused on helping first those communities that are committed to sustaining existing development through the use of greenways and other tools to protect and conserve our open spaces. Smart growth is creating and environment in which farming and urban development can co-exist. Smart growth is fostering more reliance on transit and creating housing options that allow families to stay and invest in a community. The Ventura administration continues to work on a statewide smart growth strategy, but most intensive efforts to date have focused on the metropolitan area.
|
|||||||||||||||||||||
The Big Accounting Initiative
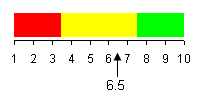
Score Goal: Increase transportation options. Goal: Restore polluted sites to beneficial use for more livable communities. Acres of contaminated land cleaned up and returned to productive use Goal: Preserve rural character and natural resource base in rural areas. Participation in Metropolitan Agricultural Preservation Program Goal: Improve water quality to achieve cleaner rivers. Water Quality Index for the Mississippi River before and after Twin Cities Goal: Improve effectiveness of wastewater treatment to protect public health and environment. Wastewater treatment plant compliance with clean water standards Goal: Increase affordable rental opportunities in the Twin City region for low and moderate income families, to help fulfill the 1995 Hollman Consent Decree. Development and operation of affordable rental housing Goal: The Twin Cities region is one of the best places to live, work, raise a family and do business. Goal: Strong public support for smart growth goals. |
|||||||||||||||||||||

|
|||||||||||||||||||||
|
|
|
||||||||||||||||||||
Note: Demand for transit service in the Twin Cities region is growing faster than service can be added. Transit ridership increased 20.4 percent from 1996 to 2000, to its highest level in 15 years - and one of the highest rates of ridership increases in the country. The Metropolitan Council’s goal is to double transit capacity by 2020 to meet projected population and job growth, needs of an aging population, increasing traffic congestion and driving costs, and the preservation of open spaces and natural areas. |
|||||||||||||||||||||
Learn more about transportation concerns ranked #1 in Twin Cities public opinion survey: http://www.metrocouncil.org/news/news_297.htm Complete transit information can be found at: http://www.metrocouncil.org/services/transportation.htm |
top
|
||||||||||||||||||||
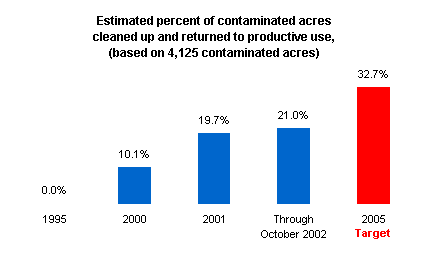
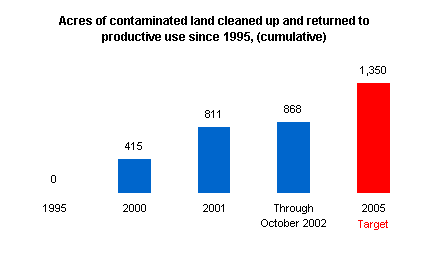
Acres of contaminated land cleaned up and returned to productive use |
|||||||||||||||||||||
 |
|||||||||||||||||||||
|
Note: The Metropolitan Council conservatively estimates that 4,125 acres are in need of cleanup assistance, based on contamination identified to date in older cities, and a similar rate of incidence as newer cities age and begin redeveloping. Land is often not known to be polluted until redevelopment efforts begin. |
|||||||||||||||||||||
Note: This measures the impact of the Tax Base Revitalization Account, a program that helps cities pay to clean up unmarketable polluted land for productive use. The Council awards grants from the Tax Base Revitalization Account to help cities pay to clean up unmarketable polluted land. During 1996 through the first half of 2002, $39.2 million in funds were targeted to 107 projects, totaling 868 acres. When these redevelopments are finished, they are expected to result in 10,500 jobs (with new jobs averaging $13.40/hour), add over $26.5 million in tax capacity, and attract $1.4 billion in private cleanup investment. Assuming a similar level of funding in the future, and similar results, the 1,350 acres cleaned up through the year 2005 would result in 16,200 jobs, add $42.7 million in tax capacity, and attract $2.1 billion in private investment. Site contamination is a much more extensive problem than the current funding level is able to address. The Metropolitan Council conservatively estimates that 4,125 acres are in need of cleanup assistance, based on contamination identified to date in older cities, and a similar rate of incidence as newer cities age and begin redeveloping. Land is often not known to be polluted until redevelopment efforts begin, and actual need may be significantly higher than the estimate. The 868 acres that have been funded for cleanup so far represent only 21% of the estimated need. |
|||||||||||||||||||||
Learn more about clean-up sites at: http://www.metrocouncil.org/services/livcomm.htm#restoring More details and grant application: http://www.metrocouncil.org/planning/assistance/taxbs.htm |
top
|
||||||||||||||||||||
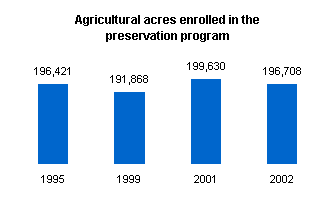
Participation in Metropolitan Agricultural Preservation Program |
|||||||||||||||||||||
|
|
|
||||||||||||||||||||
Note: Twin Cities residents place a high value on preserving open space and agricultural land. In surveys, 92 percent said agricultural land should be preserved; 65 percent indicated "strong" agreement. While the acres enrolled in the Metropolitan Agricultural Preserves program have increased since 1995, the total amount of farmland in the metro area declined by over 7%, or 90,000 acres between 1992 and 1999 (leaving roughly 707,000 acres of farmland). Between 2001 and 2002, agricultural acres enrolled in the program dropped 1.5%. Enrollment dropped in Anoka, Carver, Dakota and Hennepin counties; it increased in Scott and Washington counties. The Metropolitan Agricultural Preserves program was established in 1980 to provide tax incentives for keeping land in agricultural use. In their comprehensive plans, local governments determine which land should be certified as eligible for the program and zone the land at a density of no more than one dwelling unit per forty acres. Landowners on the eligible land can choose whether or not to enroll. Enrollment is indefinite and participating owners must give eight years notice before selling the land for other uses. Enrollment, and the decision to leave the program, can be significantly affected by increasing land values at the urban edge and the declining farm economy. Stronger tools are needed to protect agricultural areas, including enhancing the Metropolitan Agricultural Preserves program and the purchase of agricultural preservation easements. The Metropolitan Council is pursuing these and other tools in our new Regional Growth Strategy, Blueprint 2030. Data sources: U.S. Agricultural Census, Metropolitan Council |
|||||||||||||||||||||
| top
|
|||||||||||||||||||||
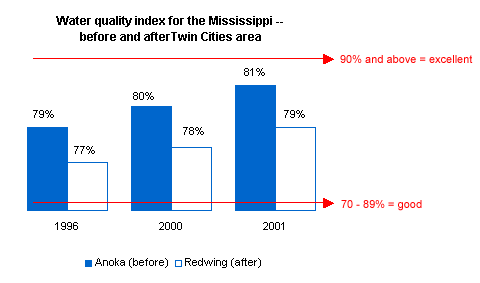
Water Quality Index for the Mississippi River before and after Twin Cities |
|||||||||||||||||||||
|
|
|
||||||||||||||||||||
Note: Based on the NSF index, where a score of 90 and above is "excellent," and 70 is "good," water quality in the Mississippi River tends to be of "good" quality. Our goal is that by 2015 the quality of the water leaving the region will be as good as when it enters. We are essentially at that point now; the slight differences between upstream and downstream points is not significant. Also, while it appears as though the quality may be slightly improving over time, differences between years can be due to a variety of uncontrollable factors such as weather. Longer-term trends are better measures of changing water quality. For the past 25 years, high-quality centralized wastewater treatment and industrial regulation have been the focus of water management efforts, and significant improvements have resulted. Future improvements will need to focus on better management of non-point sources of pollution such as storm water runoff and combined sewer overflow (CSO). This year's passage of a law restricting the use of phosphorus in most lawn fertilizers should also help. The Metropolitan Council measures the quality of the St. Croix, Minnesota and Mississippi Rivers. As the St. Croix and Minnesota Rivers empty into the Mississippi, they influence the overall water quality leaving the region. Yet, each river is a highly distinct system, reflecting agricultural practices (Minnesota River), wild and scenic protection (St. Croix), and urban and industrial uses (Mississippi), and each requires unique management practices. Data source: Data compiled by Metropolitan Council Environmental Services, based on National Sanitation Foundation (NSF) Water Quality Index. The index is a weighted composite measure that factors in oxygen level, bacteria, nutrients such as nitrogen and phosphorus, temperature, pH and solids. |
|||||||||||||||||||||
Learn more at: http://www.metrocouncil.org/environment/RiversLakes/ and http://gis.metc.state.mn.us/general/mepg/ |
top
|
||||||||||||||||||||
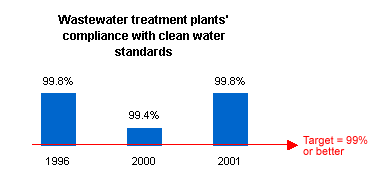
Wastewater treatment plant compliance with clean water standards |
|||||||||||||||||||||
|
|
|
||||||||||||||||||||
Note: There are eight wastewater treatment plants in the Metropolitan area. This indicator measures their overall compliance level with clean water standards. Discharges from the plants are continuously monitored to ensure public health and water quality protection. The regulatory standards must be met at all times of the year, regardless of unusual weather or other conditions. The index is based on biochemical oxygen demand, solids, ammonia and phosphorus concentrations. |
|||||||||||||||||||||
See MCES 2001 Performance Report at: http://www.metrocouncil.org/environment/2001performanceReport.pdf |
top
|
||||||||||||||||||||
|
|
|
||||||||||||||||||||
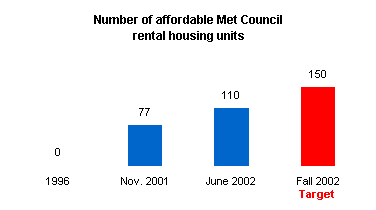
Note: In January 2000, the Metropolitan Council established its Family Affordable Housing Program to promote affordable housing opportunities and help the Minneapolis Public Housing Authority implement the housing replacement provisions of the 1995 Hollman consent decree. The decree provided for the demolition of specified Minneapolis public housing units, and made federal funding available for 770 replacement units within Minneapolis and its suburbs. Metropolitan Council has agreed to develop, own and operate a portion of these units. With the approval and cooperation of suburban municipalities, the 150 units acquired by the Metropolitan Council will be in Anoka, Hennepin and Ramsey Counties. |
|||||||||||||||||||||
More on this initiative at http://www.metrocouncil.org/news/news_167.htm |
top
|
||||||||||||||||||||
|
|
|
||||||||||||||||||||
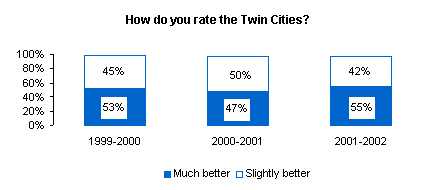
Note: Twin Cities residents continue to give their region high marks for its quality of life. Almost all respondents surveyed in winter of 2001-2002 viewed the region as a better place to live than other metro areas. Compared to the previous year's survey, a significantly higher percentage of people thought the region was "much better", while fewer responded "slightly better". Residents expressed concerns about several pressing issues-housing affordability, traffic congestion, loss of green space, spread-out development, and not enough choice of neighborhoods and transportation options. Data source: Twin Cities Area Survey is sponsored annually by Metropolitan Council and others, and is conducted by the University of Minnesota Center for Survey Research. A random sample of 804 households were interviewed by phone. |
|||||||||||||||||||||
| top
|
|||||||||||||||||||||
|
|
|
||||||||||||||||||||
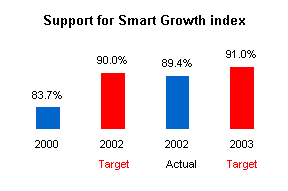
Note: Public opinion surveys show a growing interest in the quality of life improvements that are goals of more thoughtful development and redevelopment strategies. The Twin Cities Smart Growth Index rose to nearly 90 points based on survey results for winter of 2001-2002, out of a possible 100 points. The index gives equal weight to the percentage of residents agreeing with each of these statements:
Data source: Twin Cities Area Survey is sponsored annually by Metropolitan Council and others, and is conducted by the University of Minnesota Center for Survey Research. A random sample of 804 households were interviewed by phone. |
|||||||||||||||||||||
| top
|
|||||||||||||||||||||
