


What were things like in 2002?
The following idicator summary is from the 2002 Minnesota Milestones and does not neccessarily reflect the current data trends.Indicator : School transfers
Rationale: Studies of student mobility show that students who frequently change schools experience less success at school and have lower graduation rates.
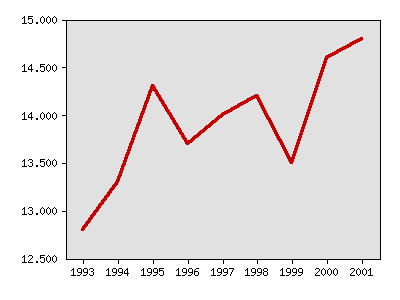
About this indicator: Although no clear trend is evident, school transfers tended to be somewhat higher in the late 1990s than earlier in the decade. The rate has fluctuated between 12.8 and 14.8 percent. Frequent moves during childhood can be associated with delinquency, depression, teen pregnancy, or dropping out of school. While children sometimes change schools for positive reasons, high or increasing numbers of transfers show instability that can cause problems for both the transferring students and the schools.
Student mobility varies greatly from district to district. It is high in communities with a large number of migrant workers, those on or near Indian reservations and in fast- growing suburbs and regional centers. School transfers also remain high in Minneapolis and St. Paul, at 35.4 percent and 29.2 percent, respectively.
Percentage of K-12 transfers
| Year | Data |
|---|---|
| Percentage of K-12 transfers, Minnesota Department of Children, Families & Learning | |
| 1993 | 12.8% |
| 1994 | 13.3% |
| 1995 | 14.3% |
| 1996 | 13.7% |
| 1997 | 14.0% |
| 1998 | 14.2% |
| 1999 | 13.5% |
| 2000 | 14.6% |
| 2001 | 14.8% |
Things to think about: Some students change schools voluntarily for personal reasons, such as a failure to make friends. Others transfer because of academics to take advantage of specific programs. Many transfers, however, result not from deliberate choice but from instability in the family's or student's situation; these may be linked to the lack of safe, decent and affordable housing in certain areas.
Another issue is the effect student mobility has on schools. The data does not show how high student mobility may affect a school's test scores.
Technical notes: The data reflects children in kindergarten through grade 12 who change schools both within and between school districts. Due to changing enrollment patterns, school mobility data is now tracked differently than in the 1990s. Cooperative and intermediate districts have been excluded from the analysis. Data from1993 forward was recalculated in March 2000 to more accurately reflect student transfers. The transfer rate now includes only transfers occurring after Labor Day. This reduced the number of transfers by two to three percent. Also, school mobility data does not include students who change schools between school years.
Sources:Minnesota Department of Children, Families & Learning, http://cfl.state.mn.us/
Related 2002 Milestones indicator:
Other related indicators:
- Number of children (and rate per 1,000) removed from their home for protection (Minnesota Department of Human Services, www.dhs.state.mn.us)
Local data:
School district level data:
County level data:


Milestones is a product of the Minnesota State Demographic Center, a division of the Department of Administration