


What were things like in 2002?
The following idicator summary is from the 2002 Minnesota Milestones and does not neccessarily reflect the current data trends.Indicator : College entrance scores
Rationale: Average ACT scores provide one of the best available indicators of students' broad, advanced skills and knowledge near high school graduation.
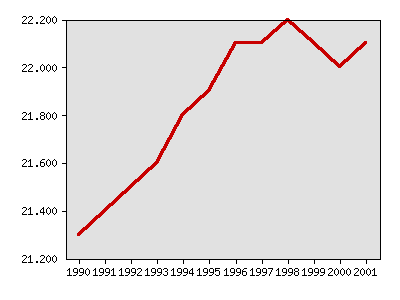
About this indicator: The average score rose slightly between 1991 and 1996 and has held fairly steady since then. At the same time, many more students are taking the ACT 66 percent of graduating students in 2001, compared to 35 percent in the late 1980s. In 2000, 92 percent of Minnesota students taking the ACT test were White, four percent were Asian/Hispanic Islander, two percent were Black/African American, one percent were Hispanic and less than one percent were American Indian.
The ACT test measures reasoning and thinking skills in English, mathematics, reading and science. A perfect score is 36 and many top colleges prefer a score of 28 or higher.
Average score of Minnesota students taking the ACT college entrance test
| Year | Data |
|---|---|
| Average score of Minnesota students taking the ACT college entrance test, ACT, Inc.and Minnesota Higher Education Services Office | |
| 1990 | 21.3 |
| 1991 | 21.4 |
| 1992 | 21.5 |
| 1993 | 21.6 |
| 1994 | 21.8 |
| 1995 | 21.9 |
| 1996 | 22.1 |
| 1997 | 22.1 |
| 1998 | 22.2 |
| 1999 | 22.1 |
| 2000 | 22.0 |
| 2001 | 22.1 |
For comparison: The average national score has remained constant for five years at 21.0. Comparison among states is difficult because in some states college-bound students take the SAT test, not the ACT. In 2001, Minnesota ranked second, behind Wisconsin, among states where more than half of graduating seniors took the ACT test.
Things to think about: The recommended study in preparation for the ACT is four years of English and three years each of science, social science and mathematics. In 2001, 67 percent of Minnesota students taking the ACT had taken this recommended college preparation curriculum, compared to 71 percent of test-takers four years earlier. In 2001, Minnesota students who took the recommended college preparatory classes scored an average of 2.5 points higher than students who did not.
Technical notes: ACT tests are held five to six times a year. Parents and students determine when the test is taken. In practice most students take the ACT test at the end of their junior year or the beginning of their senior year; it can be retaken.
Sources:ACT Inc., www.act.org
ACT High School profile for Minnesota Graduating Class 2000
Related 2002 Milestones indicator:
Other related indicators:
- Minnesota fourth-graders and eighth-graders achieving proficient scores on national math, reading and science tests (U.S. Department of Education, National Assessment of Educational Progress, http://nces.ed.gov/nationsreportcard)
- ACT scores by subject area: math, English, reading, science (ACT Inc.,www.act.org)
Local data:


Milestones is a product of the Minnesota State Demographic Center, a division of the Department of Administration