


What were things like in 2002?
The following idicator summary is from the 2002 Minnesota Milestones and does not neccessarily reflect the current data trends.Indicator : Price of government
Rationale: This indicator indirectly measures progress toward this goal by tracking how much the government spends compared to how much people earn.
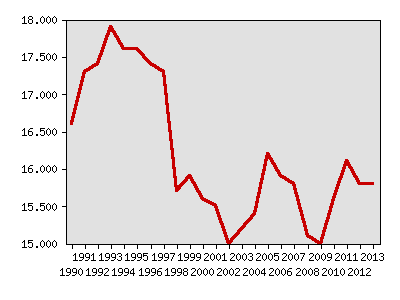
About this indicator: By this measure, the price of government rose in the early 1990s, but declined again after 1998. During the budgeting process, the Governor and Legislature are required to establish a target for the price of government: total local and state taxes and fees as a percentage of Minnesota personal income. The state has adopted a target of 16.3 percent for fiscal years 2001-02 and 2002-03.
This indicator reports the price of government based on actual revenues collected. During good economic times, revenues sometimes exceed expectations and push the actual price of government above the target set by the Governor and Legislature. In fiscal year 2001, the percentage was 15.9, well below the price of government during most of the 1990s.
State and local government taxes and fees, as a percentage of personal income
| Year | Data |
|---|---|
| State and local government taxes and fees, as a percentage of personal income, Minnesota Department of Finance | |
| 1990 | 16.6% |
| 1991 | 17.3% |
| 1992 | 17.4% |
| 1993 | 17.9% |
| 1994 | 17.6% |
| 1995 | 17.6% |
| 1996 | 17.4% |
| 1997 | 17.3% |
| 1998 | 15.7% |
| 1999 | 15.9% |
| 2000 | 15.6% |
| 2001 | 15.5% |
| 2002 | 15% |
| 2003 | 15.2% |
| 2004 | 15.4% |
| 2005 | 16.2% |
| 2006 | 15.9% |
| 2007 | 15.8% |
| 2008 | 15.1% |
| 2009 | 15% |
| 2010 | 15.6% |
| 2011 | 16.1% |
| 2012 | 15.8% |
| 2013 | 15.8% |
For comparison: Using similar data collected by the U.S. Bureau of the Census, Minnesota state and local governments collected general revenues equaling 17.5 percent of personal income in 1998-99, compared to a national rate of 15.8 percent.
Things to think about: Most state and local taxes are deductible on federal income tax returns, softening the impact of state and local taxes.
Technical notes: Most local governments begin their fiscal year in January, while state government and school districts have fiscal years that begin in July. The price of government is computed for the fiscal years ending between July 1 and June 30. For example, the 2001 price of government is based on local government revenue for the fiscal year ending December 2000 and school district and state revenue for the fiscal year ending June 2001.
Sources:Minnesota Department of Finance, Financial Forecasts and Updates: www.finance.state.mn.us
U.S. Bureau of the Census, Government Finances series: http://www.census.gov/govs/www/estimate.html
Related 2002 Milestones indicator:
Other related indicators:
- State bond ratings (available from bond rating firms)
Local data:


Milestones is a product of the Minnesota State Demographic Center, a division of the Department of Administration