


What were things like in 2002?
The following idicator summary is from the 2002 Minnesota Milestones and does not neccessarily reflect the current data trends.Custom Report:
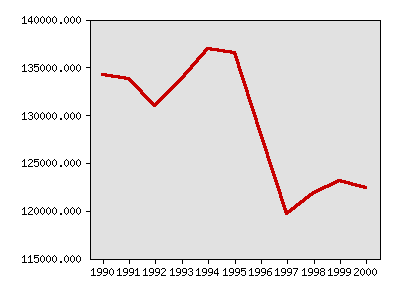
Years of potential life lost before age 65
| Year | Data |
|---|---|
| Years of potential life lost before age 65, Minnesota Department of Health | |
| 1990 | 134,183 |
| 1991 | 133,818 |
| 1992 | 130,950 |
| 1993 | 133,758 |
| 1994 | 136,950 |
| 1995 | 136,485 |
| 1996 | 128,058 |
| 1997 | 119,613 |
| 1998 | 121,875 |
| 1999 | 123,150 |
| 2000 | 122,352 |


Milestones is a product of the Minnesota State Demographic Center, a division of the Department of Administration