


Indicator 5: Low Birth Weight

Goal: All children will be healthy and start school ready to learn.
Rationale: Low birth weight is often associated with health and development problems. This goal reflects the growing scientific understanding that a healthy pregnancy and early nurturing contribute to a child's brain development and later success in school.
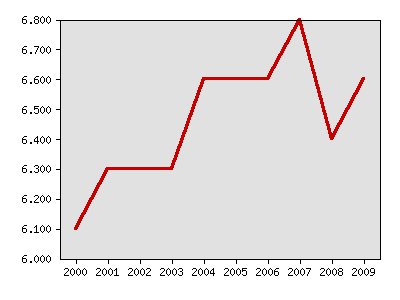
About this indicator: The percentage of babies weighing less than 2500 grams (5.5 pounds) increased from 5.1 percent in 1990 to 6.1 percent in 2000 and 6.8 percent in 2007. The 2009 value was 6.6 percent.
A considerable body of research shows that low birth weight puts infants at higher risk for health problems and developmental delays. The reasons for low birth weight are not clearly understood, but some major factors include poor prenatal care, smoking, and older or younger age of the mother. Multiple births are much more likely to be low birth weight, and the increasing number of multiple births has probably played a role in the rising rates of low birth weight.
Low birth weight
| Year | Data |
|---|---|
| Low birth weight, Minnesota Department of Health | |
| 2000 | 6.1% |
| 2001 | 6.3% |
| 2002 | 6.3% |
| 2003 | 6.3% |
| 2004 | 6.6% |
| 2005 | 6.6% |
| 2006 | 6.6% |
| 2007 | 6.8% |
| 2008 | 6.4% |
| 2009 | 6.6% |
For comparison: Nationwide, 8.2 percent of babies were low birth weight in 2007.
Technical notes: The low birth weight figures reflect only those births for which a birth weight is reported. Some births, such as infants born at home, may be excluded.
Sources:
- Minnesota Department of Health, Center for Health Statistics, http://www.health.state.mn.us/
- U.S. Centers for Disease Control and Prevention, National Center for Health Statistics, http://www.cdc.gov/nchs
Related 2002 Milestones indicator:
Local data:


Milestones is a product of the Minnesota State Demographic Center, a division of the Department of Administration