This Web-based document was archived by the Minnesota Legislative Reference Library.
Minnesota Milestones 2010:
 
 
How is Minnesota doing?
Keep an eye out for these images to quickly tell which way the trend is going:
Thumbs down
Undesirable or negative
Thumbs maybe
No change, or not enough data to draw conclusions
Thumbs up
Desirable or positive.

What were things like in 2002?

The following idicator summary is from the 2002 Minnesota Milestones and does not neccessarily reflect the current data trends.
login

Custom Report:

Public school ninth-graders who four years later continued, White (percent)
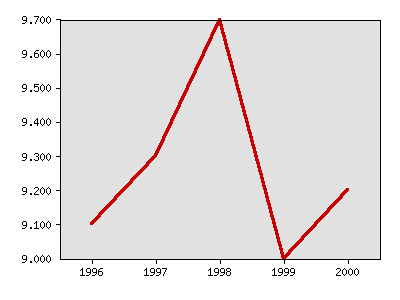

graph
Public school ninth-graders who four years later continued, White (percent)
YearData
Public school ninth-graders who four years later continued, White (percent), Minnesota Department of Children, Families & Learning
1996 9.1%
1997 9.3%
1998 9.7%
1999 9.0%
2000 9.2%
Public school ninth-graders who four years later continued, White (percent)
YearData
Public school ninth-graders who four years later continued, White (percent), Minnesota Department of Children, Families & Learning Edit trend | Edit data
Public school ninth-graders who four years later continued, White (percent)
19969.1%
19979.3%
19989.7%
19999.0%
20009.2%
         Select data sets for individual graphing:
Local data:

Milestones is a product of the Minnesota State Demographic Center, a division of the Department of Administration