


What were things like in 2002?
The following idicator summary is from the 2002 Minnesota Milestones and does not neccessarily reflect the current data trends.Custom Report:
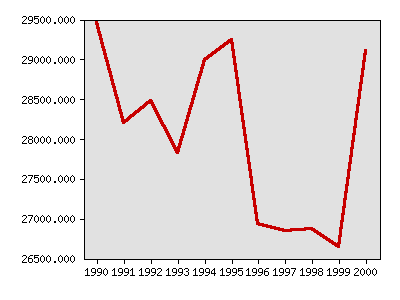
Years of potential life lost to unintentional injury
| Year | Data |
|---|---|
| Years of potential life lost to unintentional injury, Minnesota Department of Health | |
| 1990 | 29,450.0 |
| 1991 | 28,202.5 |
| 1992 | 28,477.5 |
| 1993 | 27,822.5 |
| 1994 | 28,995.0 |
| 1995 | 29,245.0 |
| 1996 | 26,935.0 |
| 1997 | 26,847.5 |
| 1998 | 26,870.0 |
| 1999 | 26,650.0 |
| 2000 | 29,100.0 |
Local data:


Milestones is a product of the Minnesota State Demographic Center, a division of the Department of Administration