


Indicator 51: Energy use per person

Goal: Minnesotans will improve the quality of the air, water and earth.
Rationale: Continued prosperity and community well-being depend on conserving and maintaining the natural systems that are the base for economic activity. Energy use is a good measure of both economic and environmental health because virtually all economic activities require energy, and all forms of energy production and use have environmental impacts.
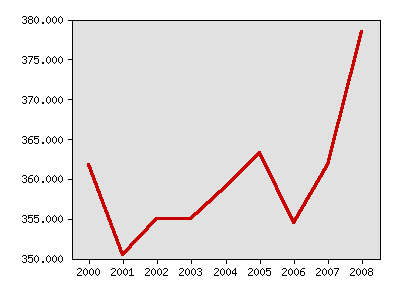
About this indicator: Energy use per person, measured in millions of BTUs, was higher in 2008 than in any other year since 2000. The level remains substantially higher than in the early 1990s.
Energy use per person in millions of BTU's
| Year | Data |
|---|---|
| Energy use per person in millions of BTU's, U.S. Department of Energy | |
| 2000 | 361.7 |
| 2001 | 350.4 |
| 2002 | 355.0 |
| 2003 | 355.0 |
| 2004 | 359.0 |
| 2005 | 363.2 |
| 2006 | 354.5 |
| 2007 | 361.7 |
| 2008 | 378.4 |
For comparison: In 2008, Minnesota ranked 18th highest among states in per capital energy consumption. Minnesotas per capita consumption level, 378.8 million BTUs per person, was above the national average of 326.5.
Sources:
- U.S. Energy Information Agency, http://www.eia.doe.gov/emeu/states/state.html?q_state_a=mn&q_state=MINNESOTA
- U.S. Census Bureau Population estimates, http://www.census.gov/popest/estimates.html
Related 2002 Milestones indicator:
Local data:


Milestones is a product of the Minnesota State Demographic Center, a division of the Department of Administration