


What were things like in 2002?
The following idicator summary is from the 2002 Minnesota Milestones and does not neccessarily reflect the current data trends.Indicator : Poverty rate
Rationale: Measuring the percentage of Minnesotans who live in poverty gives an indication of how many Minnesotans are not financially able to maintain a minimum standard of living.
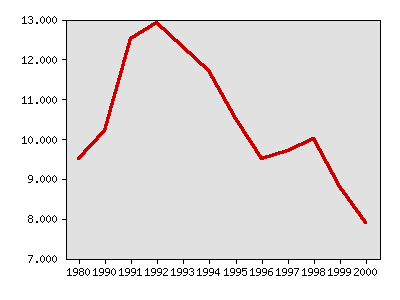
About this indicator: The percent of Minnesotans in poverty decreased from 10.2 percent in 1990 to 7.9 percent in 2000. The rate was as high as 13 percent in the early 1990s, but fell below 10 percent during the strong economic boom of the late 1990s. The 2000 federal poverty threshold for a family of four was $17,603. Many Minnesotans with incomes above the poverty line still have difficulty making ends meet.
Percentage of Minnesotans with income below the federal poverty level
| Year | Data |
|---|---|
| Percentage of Minnesotans with income below the federal poverty level, U.S. Bureau of the Census | |
| 1980 | 9.5% |
| 1990 | 10.2% |
| 1991 | 12.5% |
| 1992 | 12.9% |
| 1993 | 12.3% |
| 1994 | 11.7% |
| 1995 | 10.5% |
| 1996 | 9.5% |
| 1997 | 9.7% |
| 1998 | 10% |
| 1999 | 8.8% |
| 2000 | 7.9% |
For comparison: Minnesota has historically had lower poverty rates than the nation as a whole. In 2000, when the national rate was 12.4 percent, Minnesota's rate was 7.9 percent, or third in the nation. New Hampshire had the lowest poverty rate at 6.5 percent, while Mississippi had the highest at 19.9 percent.
Things to think about: Because income at the federally determined poverty line affords only a minimal standard of living, critics have argued for a new self-sufficiency measure. Poverty is strongly related to other disturbing social and economic conditions such as poor health, decreased economic opportunity and higher crime rates.
Technical notes: Data shows a two-year average for non-Census years. The averaging method is used to compensate for the margin of error in survey estimates of state poverty rates. The year listed is the last year of the two-year average.
Sources:U.S. Bureau of the Census, Decennial Census, 1980, 1990 and 2000; estimates for other years, Current Population Survey: www.census.gov
Related 2002 Milestones indicator:


Milestones is a product of the Minnesota State Demographic Center, a division of the Department of Administration