


What were things like in 2002?
The following idicator summary is from the 2002 Minnesota Milestones and does not neccessarily reflect the current data trends.Custom Report:
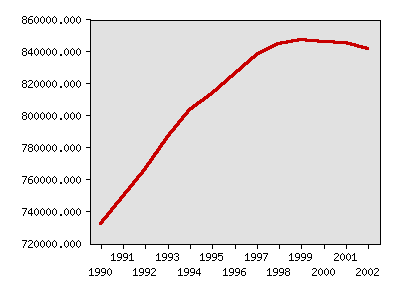
Enrollment of public school children (K-12), total
| Year | Data |
|---|---|
| Enrollment of public school children (K-12), total, Minnesota Department of Children, Families & Learning | |
| 1990 | 731,992 |
| 1991 | 749,203 |
| 1992 | 766,029 |
| 1993 | 786,413 |
| 1994 | 803,436 |
| 1995 | 813,144 |
| 1996 | 826,137 |
| 1997 | 837,728 |
| 1998 | 844,416 |
| 1999 | 847,308 |
| 2000 | 845,839 |
| 2001 | 845,040 |
| 2002 | 841,697 |


Milestones is a product of the Minnesota State Demographic Center, a division of the Department of Administration