


What were things like in 2002?
The following idicator summary is from the 2002 Minnesota Milestones and does not neccessarily reflect the current data trends.Custom Report:
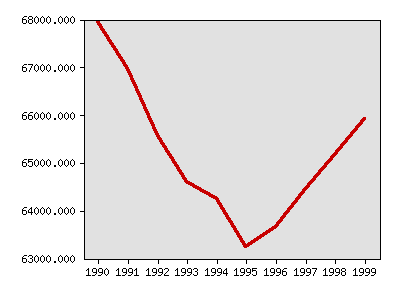
Live births with known birth weight
| Year | Data |
|---|---|
| Live births with known birth weight, Minnesota Department of Health | |
| 1990 | 67,939 |
| 1991 | 66,973 |
| 1992 | 65,566 |
| 1993 | 64,607 |
| 1994 | 64,242 |
| 1995 | 63,236 |
| 1996 | 63,669 |
| 1997 | 64,453 |
| 1998 | 65,170 |
| 1999 | 65,912 |


Milestones is a product of the Minnesota State Demographic Center, a division of the Department of Administration