This Web-based document was archived by the Minnesota Legislative Reference Library.
Minnesota Milestones 2010: Foreclosures
 
 
How is Minnesota doing?
Keep an eye out for these images to quickly tell which way the trend is going:
Thumbs down
Undesirable or negative
Thumbs maybe
No change, or not enough data to draw conclusions
Thumbs up
Desirable or positive.
login

Indicator 47: Foreclosures

Thumbs downimage
Goal: All Minnesotans will have decent, safe and affordable housing.
Rationale: Foreclosures create severe stress for homeowners and contribute to lower property values, abandoned housing and a depressed housing and construction industry.
About this indicator: The number of foreclosures in Minnesota rose sharply from 6,472 in 2005 to 26,261 in 2008 and then dipped to 23,019 in 2009. In the first three quarters of 2010 there were 21,347 foreclosures. This suggests 2010 foreclosures will likely rival 2008 for the highest number recorded.
Number of foreclosures in Minnesota


graph
Number of foreclosures in Minnesota
YearData
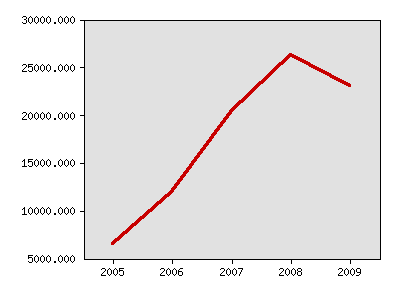
Number of foreclosures in Minnesota, Housing Link
2005 6,472
2006 11,907
2007 20,398
2008 26,261
2009 23,019
For comparison: The highest rates of foreclosure were in outer-ring suburbs of the Twin Cities, including Wright, Scott and Sherburne counties. These are rapidly-growing counties where many homes were purchased in recent years.

Minnesota has more foreclosures than many other states, and foreclosures are growing faster than the national average. According to RealtyTrac, in the third quarter of 2009 Minnesota had one foreclosure for every 217 households. Though lower than the national rate of one per 136 households, this rate was the 18th highest among states.

Between the second and third quarters of 2009, foreclosures in Minnesota grew 16 percent compared to the national average of 5 percent. From the third quarter of 2008 to the third quarter of 2009, Minnesota foreclosures increased 100 percent, the 9th highest gain among states. The national year-to-year figure was 23 percent.

The Housing Link and RealtyTrac numbers are collected using different methodologies and covering different time periods, so figures from the two sources will vary. Both show the volatility and rapid changes that have occurred in foreclosure activity.

Things to think about: The 2009 quarterly data indicate the number of foreclosures is declining, but some experts predict another upswing in the near future because of high unemployment.
Technical notes: Housing Link collects its data from Sheriff’s sales.
Sources:
Local data:

Milestones is a product of the Minnesota State Demographic Center, a division of the Department of Administration