This Web-based document was archived by the Minnesota Legislative Reference Library.
Minnesota Milestones 2010: Drinking water quality
 
 
How is Minnesota doing?
Keep an eye out for these images to quickly tell which way the trend is going:
Thumbs down
Undesirable or negative
Thumbs maybe
No change, or not enough data to draw conclusions
Thumbs up
Desirable or positive.
login

Indicator 56: Drinking water quality

Thumbs maybeimage
Goal: Minnesotans will improve the quality of the air, water and earth.
Rationale: Harmful chemicals, nutrients and bacteria in the drinking supply can adversely affect public health in both the short term and long term.
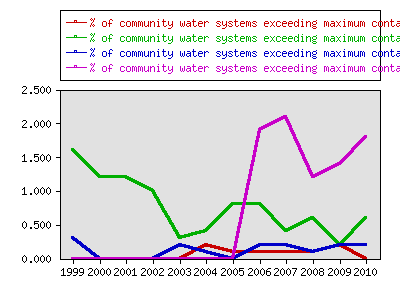
About this indicator: Data collected by the Minnesota Department of Health show high quality for almost all of the state’s community water systems. Only a very small number violate maximum contaminant level standards for arsenic, nitrate, disinfection byproducts or lead.
graph
Percent of community water systems exceeding maximum contaminant level, Lead
YearData
Percent of community water systems exceeding maximum contaminant level, Arsenic, Edit trend | Edit data
Percent of community water systems exceeding maximum contaminant level, Nitrate, Edit trend | Edit data
Percent of community water systems exceeding maximum contaminant level, Disinfection byproducts, Edit trend | Edit data
Percent of community water systems exceeding maximum contaminant level, Lead, Edit trend | Edit data
% of community water systems exceeding maximum contaminant level for Arsenic % of community water systems exceeding maximum contaminant level for Nitrate % of community water systems exceeding maximum contaminant level for disinfection byproducts % of community water systems exceeding maximum contaminant level for lead
19990.0 0.3 0.0 1.6
20000.0 0.0 0.0 1.2
20010.0 0.0 0.0 1.2
20020.0 0.0 0.0 1.0
20030.0 0.2 0.0 0.3
20040.0 0.1 0.2 0.4
20050.0 0.0 0.1 0.8
20061.9 0.2 0.1 0.8
20072.1 0.2 0.1 0.4
20081.2 0.1 0.1 0.6
20091.4 0.2 0.2 0.2
20101.8 0.2 0 0.6
         Select data sets for individual graphing:
Create merged graph of all datasets
Create merged graph of selected datasets

Things to think about: The contamination measures in the MDH report do not cover water from private wells. Some people are concerned about the presence in water supplies of contaminants for which we are not yet testing. These include pharmaceuticals and industrial chemicals such as PCBs. Ongoing research projects will provide better information about the presence of these chemical in Minnesota’s water supply.
Technical notes: Standards for arsenic contamination became stricter in 2006. This explains the increase in community water systems violating the standard.
Sources:
Local data:

Milestones is a product of the Minnesota State Demographic Center, a division of the Department of Administration