


What were things like in 2002?
The following idicator summary is from the 2002 Minnesota Milestones and does not neccessarily reflect the current data trends.Indicator : Sense of safety
Rationale: This indicator measures people's perceptions about their safety.
About this indicator: Survey results on Minnesotans' sense of safety have remained fairly constant since the mid-1990s. The survey asks: How safe do you feel in the community where you live? In 2001, 93 percent of respondents felt either always safe or almost always safe. In 1999, 92 percent of respondents said they felt always safe or almost always safe. In similar surveys in 1996 and 1997, 93 and 97 percent, respectively, said they felt always safe or usually safe."
Percentage of people who feel safe in their communities
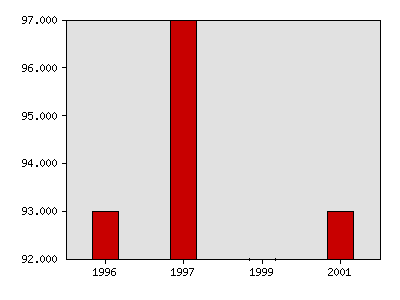
| Year | Data |
|---|---|
| Percentage of people who feel safe in their communities, Minnesota Planning and University of Minnesota, Minnesota Center for Survey Research | |
| 1996 | 93% |
| 1997 | 97% |
| 1999 | 92% |
| 2001 | 93% |
For comparison: Actual crime rates, both in Minnesota and nationally, have dropped noticeably since the mid-1990s, for both property and violent crime.
Things to think about: People's sense of safety is based on a variety of feelings and experiences. People sometimes feel unsafe even when risks to their safety are relatively small. News coverage of local and national events can strongly influence how people feel about their personal safety. When people feel safe, they are more likely to be outside their homes and involved in community activities. This can work the other way also; people who are actively involved in community life often tend to feel safer.
Technical notes: In each of the four years the survey question was asked, the possible responses were worded slightly differently, making it difficult to compare results.
Sources:Minnesota Planning, Criminal Justice Center, Keeping Watch: 1999 Minnesota Crime Survey, www.mnplan.state.mn.us/press/2000/cj/crime99.html
University of Minnesota, Minnesota Center for Survey Research, 1997 Minnesota State Survey and 2001 Minnesota State Survey, www.cura.umn.edu/programs.html
National Crime Prevention Council, Are We Safe? The 2000 National Crime Prevention Survey, www.ncpc.org/rwesafe
Related 2002 Milestones indicator:
Other related indicators:
- School children who feel safe or very safe at school (Office of the Minnesota Attorney General, Safe Schools 2000 survey), www.ag.state.mn.us/classroom/safeSchls_00.htm
Local data:


Milestones is a product of the Minnesota State Demographic Center, a division of the Department of Administration