


What were things like in 2002?
The following idicator summary is from the 2002 Minnesota Milestones and does not neccessarily reflect the current data trends.Custom Report:
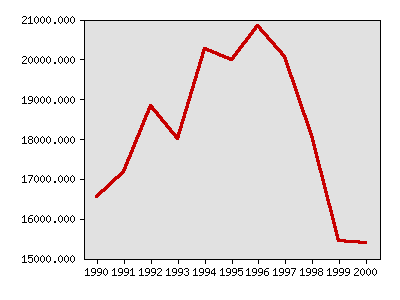
Apprehensions of youth for violent crime and serious property crime
| Year | Data |
|---|---|
| Apprehensions of youth for violent crime and serious property crime, Minnesota Department of Public Safety | |
| 1990 | 16,546 |
| 1991 | 17,178 |
| 1992 | 18,840 |
| 1993 | 18,001 |
| 1994 | 20,268 |
| 1995 | 19,978 |
| 1996 | 20,839 |
| 1997 | 20,066 |
| 1998 | 18,073 |
| 1999 | 15,431 |
| 2000 | 15,398 |


Milestones is a product of the Minnesota State Demographic Center, a division of the Department of Administration