This Web-based document was archived by the Minnesota Legislative Reference Library.
Minnesota Milestones 2010: Unemployment Rate
 
 
How is Minnesota doing?
Keep an eye out for these images to quickly tell which way the trend is going:
Thumbs down
Undesirable or negative
Thumbs maybe
No change, or not enough data to draw conclusions
Thumbs up
Desirable or positive.
login

Indicator 38: Unemployment Rate

Thumbs maybeimage
Goal: Minnesota will have sustainable, strong economic growth.
Rationale: The unemployment rate affects people’s financial well-being as well as overall state economic growth.
About this indicator: As the economy slumped in the 2000s, the annual unemployment rate grew from 4.0 percent in 2000 to 8.0 percent in 2009. Unemployment has leveled and begun to decline in 2010. The US average for 2009 was 9.3 percent.
graph
United States unemployment rate
YearData
Minnesota unemployment rate, Minnesota Department of Employment and Economic Development Edit trend | Edit data
United States unemployment rate, Minnesota Department of Employment and Economic Development Edit trend | Edit data
Unemployment rate, MN Unemployment rate, United States
19904.9% 5.6%
19915.1% 6.8%
19925.2% 7.5%
19935.1% 6.9%
19944% 6.1%
19953.7% 5.6%
19964% 5.4%
19973.3% 4.9%
19982.5% 4.5%
19992.8% 4.2%
20003.1% 4%
20013.8% 4.7%
20024.5% 5.8%
20034.9% 6%
20044.6% 5.6%
20054.2% 5.1%
20064.1% 4.6%
20074.6% 4.6%
20085.4% 5.8%
20098% 9.3%
         Select data sets for individual graphing:
Create merged graph of all datasets
Create merged graph of selected datasets

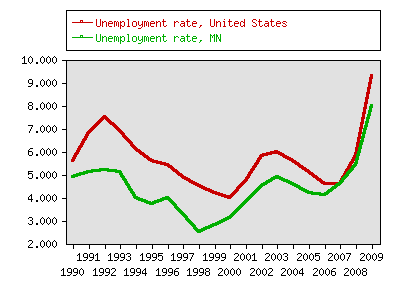
For comparison: In November, 2010 the state unemployment rate stood at 7.1 percent seasonally adjusted, lower than the U.S. rate of 9.8 percent. Unemployment has declined moderately during 2010.
Things to think about: The unemployment rate is estimated and does not always follow the trend in other labor market indicators such as the number of jobs. The unemployment rate can go down if people give up looking for jobs, or conversely it can go up if improved economic prospects draw more workers into the job market.
Sources:
Local data:
County level data:
Minnesota unemployment rate

Note: Select up to five items by holding down the control or command key.

Create Map:
Minnesota unemployment rate

Select a Year to have a state map drawn which displays the data for the year you choose.


Milestones is a product of the Minnesota State Demographic Center, a division of the Department of Administration