


Indicator 35: Employment/population ratio


Goal: Minnesota will have sustainable, strong economic growth.
Rationale: A high employment/population ratio means that a large fraction of the population is working and paying taxes. It contributes to greater economic growth because employed people have more money to spend.
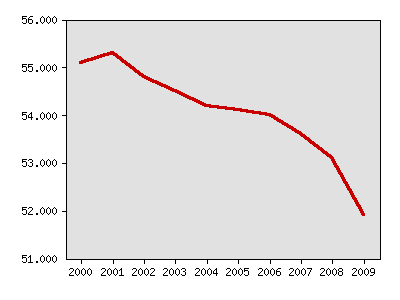
About this indicator: The employment to population ratio declined from 55.1 in 2000 to 53.1 in 2008 and then more sharply to 51.9 in 2009. The Great Recession is responsible for the sharp drop from 2008 to 2009, while slow job growth is probably a major reason for the earlier decline. Baby boomer retirements and lower workforce participation by young adults are other factors in the gradual downward drift.
Employment to population ratio
| Year | Data |
|---|---|
| Employment to population ratio, Minnesota Department of Employment and Economic Development and U.S. Census Bureau | |
| 2000 | 55.1 |
| 2001 | 55.3 |
| 2002 | 54.8 |
| 2003 | 54.5 |
| 2004 | 54.2 |
| 2005 | 54.1 |
| 2006 | 54.0 |
| 2007 | 53.6 |
| 2008 | 53.1 |
| 2009 | 51.9 |
Things to think about: The aging of the baby boom generation is expected to produce a lower employment/population ratio in the future, with negative implications for state tax revenues.
Sources:
- Employment data from Minnesota Department of Employment and Economic Development LAUS data, http://www.deed.state.mn.us/lmi/Home.htm
- Population estimates from U.S. Census Bureau, http://www.census.gov/popest/estimates.html
Local data:


Milestones is a product of the Minnesota State Demographic Center, a division of the Department of Administration