


Indicator 52: Air quality


Goal: Minnesotans will improve the quality of the air, water and earth.
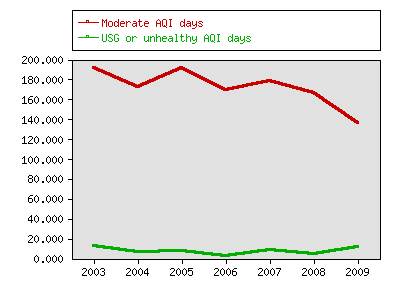
Rationale: Air quality in the Twin Cities metropolitan area, Minnesota's most urbanized region, is one indicator of the state's air quality.
About this indicator: Air quality in the Twin Cities is often not as good as it should be. Since 2003, the number of days classified as moderate air quality has fluctuated between 136 and 191. The number of days classified as unhealthy or unhealthy for sensitive groups (for example, people with asthma) has varied between 3 and 13. No clear trend is evident.
For comparison: Air quality standards have changed over time and become more rigorous. Data collected before 2003 was evaluated using older criteria and cannot be directly compared to the more recent values. The newer numbers use more stringent ozone standards and continuous monitoring of fine particles.
Sources:
- Minnesota Pollution Control Agency, Air Quality in Minnesota: Emerging Trends 2009 Report to the Legislature, January 2009. http://www.pca.state.mn.us/publications/lraq-1sy09.pdf
Related 2002 Milestones indicator:
Local data:


Milestones is a product of the Minnesota State Demographic Center, a division of the Department of Administration