


What were things like in 2002?
The following idicator summary is from the 2002 Minnesota Milestones and does not neccessarily reflect the current data trends.Indicator : Growth in gross state product
Rationale: Gross state product is the most commonly used measure of overall economic production. Continuous growth in gross state product is a strong indication of a healthy economy.
About this indicator: Minnesota's annual real growth in gross state product has been strong and steady since 1996, with growth rates 4.5 percent and higher. Gross state product is the value of all goods and services produced in the state. This economic growth contributed to historically low unemployment levels as well as significant gains in personal income. Strong worker productivity gains during the 1990s were a contributing factor in the robust growth in gross state product.
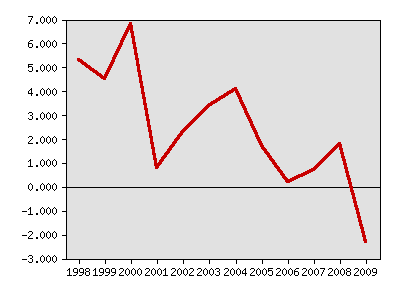
Annual real growth in the gross state product
| Year | Data |
|---|---|
| Annual real growth in the gross state product, U.S. Department of Commerce | |
| 1998 | 5.3% |
| 1999 | 4.5% |
| 2000 | 6.8% |
| 2001 | 0.8% |
| 2002 | 2.3% |
| 2003 | 3.4% |
| 2004 | 4.1% |
| 2005 | 1.7% |
| 2006 | 0.2% |
| 2007 | 0.7% |
| 2008 | 1.8% |
| 2009 | -2.3% |
For comparison: Between 1990 and 2000, Minnesota's gross state product grew faster than the national gross state product in every year except 1990, 1993, 1995 and 1999. Between 1996 and 2000, Minnesota also outperformed the Plains States region as a whole (Iowa, Kansas, Minnesota, Missouri, Nebraska, North Dakota and South Dakota).
Things to think about: While gross state product is a good measure of the overall productivity of an economy, it does not measure general well-being or quality of life. Redefining Progress, a California public policy institute, notes that the gross state product makes no distinction between spending that contributes to well-being and spending that diminishes it. For example, expenditures that result in pollution and expenditures to clean up that pollution both increase the gross state product.
Technical notes: There is at least a two-year lag in reporting gross state product data.
Sources:U.S. Department of Commerce, Bureau of Economic Analysis, regional accounts data, www.bea.doc.gov/bea/regional/data.htm
Redefining Progress, The Genuine Progress Indicator, www.redefiningprogress.org
Related 2002 Milestones indicator:
Other related indicators:
- Worker productivity, measured as gross state product per employee (Bureau of Economic Analysis; http://www.bea.doc.gov; and Minnesota Department of Economic Security, www.mnworkforcecenter.org)
- Total employment (Minnesota Department of Economic Security, www.mnworkforcecenter.org)
- Value added to raw materials through manufacturing, comparing Minnesota to the United States (U.S. Census Bureau, Annual Survey of Manufacturers, www.census.gov/econ/www/ma0300.html)
Local data:


Milestones is a product of the Minnesota State Demographic Center, a division of the Department of Administration