


What were things like in 2002?
The following idicator summary is from the 2002 Minnesota Milestones and does not neccessarily reflect the current data trends.Custom Report:
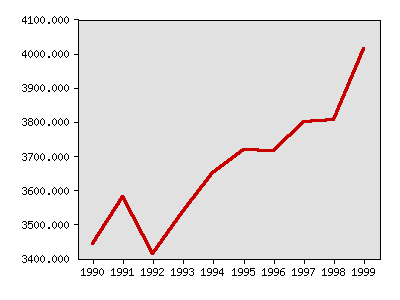
Low birth weight babies, total
| Year | Data |
|---|---|
| Low birth weight babies, total, Minnesota Department of Health | |
| 1990 | 3,443 |
| 1991 | 3,579 |
| 1992 | 3,414 |
| 1993 | 3,537 |
| 1994 | 3,651 |
| 1995 | 3,717 |
| 1996 | 3,716 |
| 1997 | 3,801 |
| 1998 | 3,806 |
| 1999 | 4,015 |


Milestones is a product of the Minnesota State Demographic Center, a division of the Department of Administration