


What were things like in 2002?
The following idicator summary is from the 2002 Minnesota Milestones and does not neccessarily reflect the current data trends.Custom Report:
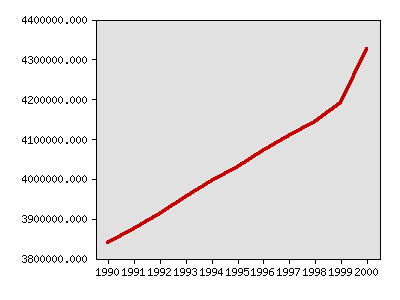
Population, ages 0-64
| Year | Data |
|---|---|
| Population, ages 0-64, U.S. Bureau of the Census | |
| 1990 | 3,839,318 |
| 1991 | 3,873,393 |
| 1992 | 3,911,219 |
| 1993 | 3,955,437 |
| 1994 | 3,994,902 |
| 1995 | 4,029,874 |
| 1996 | 4,068,969 |
| 1997 | 4,106,747 |
| 1998 | 4,142,902 |
| 1999 | 4,190,114 |
| 2000 | 4,325,213 |


Milestones is a product of the Minnesota State Demographic Center, a division of the Department of Administration