Indicator 28: Bias Crimes


Goal: All people will be welcomed, respected and able to participate fully in Minnesota's communities and economy.
Rationale: Incidents of bias or hate crimes are harmful not only to the individual victims, but also to Minnesota communities and neighborhoods. They indicate a lack of acceptance of the increasing diversity of Minnesota's communities.
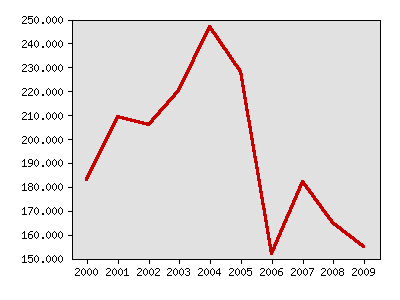
About this indicator: In 2009, 155 bias crimes were reported. The number has fluctuated from year to year with no long-term trend evident.
Racial bias was the most common type of bias (65 percent), followed by sexual orientation (18 percent).
Reported bias crimes

| Year | Data |
|---|---|
| Reported bias crimes, Minnesota Department of Public Safety | |
| 2000 | 183 |
| 2001 | 209 |
| 2002 | 206 |
| 2003 | 220 |
| 2004 | 247 |
| 2005 | 228 |
| 2006 | 152 |
| 2007 | 182 |
| 2008 | 165 |
| 2009 | 155 |
For comparison: The FBI collects data on bias crimes, but data from various areas is not comparable.
Sources:
- Minnesota Department of Public Safety, Bureau of Criminal Apprehension, Minnesota Justice Information Services, http://www.bca.state.mn.us/CJIS/Documents/Page-15-02.html
Local data:


