


What were things like in 2002?
The following idicator summary is from the 2002 Minnesota Milestones and does not neccessarily reflect the current data trends.Custom Report:
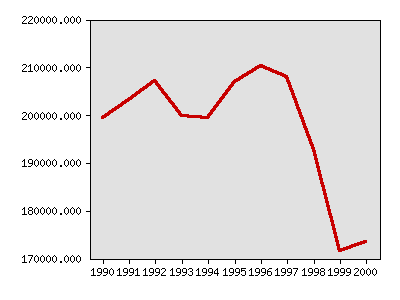
Total crimes reported, violent and serious
| Year | Data |
|---|---|
| Total crimes reported, violent and serious, Minnesota Department of Public Safety | |
| 1990 | 199,345 |
| 1991 | 203,107 |
| 1992 | 207,047 |
| 1993 | 199,725 |
| 1994 | 199,346 |
| 1995 | 206,884 |
| 1996 | 210,246 |
| 1997 | 207,971 |
| 1998 | 192,737 |
| 1999 | 171,516 |
| 2000 | 173,503 |
Local data:
County level data:


Milestones is a product of the Minnesota State Demographic Center, a division of the Department of Administration