


What were things like in 2002?
The following idicator summary is from the 2002 Minnesota Milestones and does not neccessarily reflect the current data trends.Custom Report:
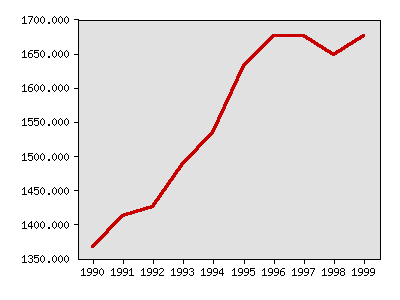
Energy consumed, trillion BTUs
| Year | Data |
|---|---|
| Energy consumed, trillion BTUs, Minnesota Department of Public Service and U.S. Department of Commerce | |
| 1990 | 1,366.9 |
| 1991 | 1,412.3 |
| 1992 | 1,425.3 |
| 1993 | 1,488.6 |
| 1994 | 1,533.5 |
| 1995 | 1,631.9 |
| 1996 | 1,676.0 |
| 1997 | 1,675.3 |
| 1998 | 1,648.5 |
| 1999 | 1,675.3 |
Local data:


Milestones is a product of the Minnesota State Demographic Center, a division of the Department of Administration