


What were things like in 2002?
The following idicator summary is from the 2002 Minnesota Milestones and does not neccessarily reflect the current data trends.Custom Report:
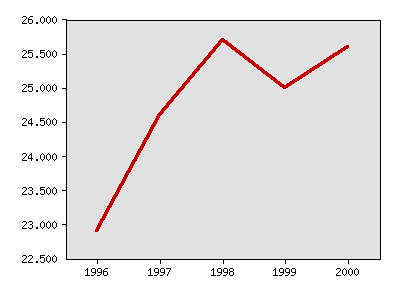
Public school ninth-graders who four years later continued, Black/ African American (percent)
| Year | Data |
|---|---|
| Public school ninth-graders who four years later continued, Black/ African American (percent), Minnesota Department of Children, Families & Learning | |
| 1996 | 22.9% |
| 1997 | 24.6% |
| 1998 | 25.7% |
| 1999 | 25.0% |
| 2000 | 25.6% |
Local data:


Milestones is a product of the Minnesota State Demographic Center, a division of the Department of Administration