


Indicator 58: Loon populations

Goal: Minnesotans will restore and maintain healthy ecosystems that support diverse plants and wildlife.
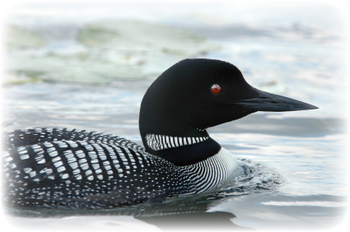
Rationale: Many citizens are concerned about the well-being of Minnesotas state bird. Loons are sensitive to acid rain, density of human population, and other factors. This makes loon populations a good indicator of the health of lake ecosystems.
About this indicator: Minnesotas loon population appears to be stable over the last 15 years.
The DNR, with the assistance of hundreds of volunteers, gathers information about loon numbers on more than 600 lakes in six index regions of the state. These six regions represent different types of lakes and habitats. Volunteers visit each lake in early July and count the number of adult and juvenile loons.
| 1994 | 1995 | 1996 | 1997 | 1998 | 1999 | 2000 | 2001 | 2002 | 2003 | 2004 | 2005 | 2006 | 2007 | 2008 | 2009 | |
| Aitkin/Crow Wing | 2.2 | 2.3 | 2.5 | 2.4 | 2.7 | 2.5 | 2.6 | 2.3 | 2.7 | 2.7 | 2.6 | 2.7 | 2.6 | 2.9 | 2.9 | 2.9 |
| Becker | 2.4 | 1.7 | 1.7 | 1.9 | 2.1 | 2.1 | 1.6 | 2.5 | 2.3 | 2.2 | 1.9 | 1.7 | 2.1 | 1.6 | 2.1 | 1.5 |
| Cook/Lake | 2.4 | 1.9 | 1.5 | 2 | 1.8 | 1.9 | 0.9 | 1.7 | 2.2 | 1.9 | 2 | 1.7 | 2.6 | 1.3 | 1.1 | 1.0 |
| Itasca | 4.2 | 3.8 | 4.2 | 3.7 | 3.6 | 3.1 | 4.1 | 3.5 | 4.2 | 3.7 | 4.9 | 4 | 3.5 | 3.5 | 3.2 | 3.6 |
| Kandiyohi | 0.8 | 0.6 | 0.7 | 0.8 | 0.6 | 0.5 | 0.9 | 0.8 | 0.6 | 0.7 | 0.6 | 1 | 0.6 | 0.6 | 0.7 | 0.7 |
| Otter Tail | 1.5 | 1.5 | 1.9 | 1.6 | 1.3 | 1.7 | 1.5 | 1.6 | 1.3 | 1.5 | 1.4 | 1.7 | 1.9 | 1.2 | 1.6 | 2.3 |
For comparison: Loon population density varies among parts of the state. Within each region, the numbers appear to be stable or increasing.
Sources:
- Minnesota Department of Natural Resources, http://www.dnr.state.mn.us/eco/nongame/projects/mlmp_state.html
Local data:


Milestones is a product of the Minnesota State Demographic Center, a division of the Department of Administration