


What were things like in 2002?
The following idicator summary is from the 2002 Minnesota Milestones and does not neccessarily reflect the current data trends.Custom Report:
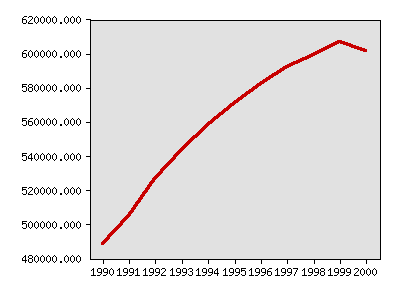
Population, ages 10-17
| Year | Data |
|---|---|
| Population, ages 10-17, U.S. Bureau of the Census | |
| 1990 | 488,701 |
| 1991 | 505,076 |
| 1992 | 526,427 |
| 1993 | 543,432 |
| 1994 | 558,186 |
| 1995 | 571,336 |
| 1996 | 582,153 |
| 1997 | 591,948 |
| 1998 | 599,044 |
| 1999 | 606,743 |
| 2000 | 601,406 |


Milestones is a product of the Minnesota State Demographic Center, a division of the Department of Administration