


Indicator 33: Growth in Gross State Product


Goal: Minnesota will have sustainable, strong economic growth.
Rationale: Economic growth creates jobs and may increase opportunities for better jobs and improved living standards. Sustainable, strong economic growth puts Minnesota in a better position to achieve other Minnesota Milestones goals.
Gross state product is the most commonly used measure of overall economic production. Continuous growth in gross state product is a strong indication of a healthy economy.
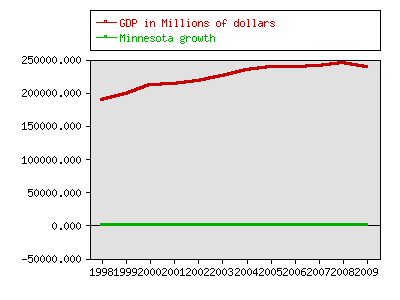
About this indicator: Minnesota's gross state product declined by 2.3 percent in 2009, after four years of tepid growth. Growth was stronger in the late 1990s, when annual growth rates ranged between 3 and 5 percent.
Gross state product is the value of all goods and services produced in the state.
For comparison: Among 50 states and the District of Columbia, Minnesota ranked 46th in gross state product growth between 2000 and 2009. Minnesotas gain of 38 percent was below the national average of 43 percent percent. Per capita personal income (a major component of GDP) growth during the same period was also slower than the national average. Minnesota's rank in per capita personal income declined from 13th in 2000 to 18th in 2009.
Technical notes: The indicator used is millions of 2005 chained dollars. Because of changes in the industrial classification system, totals for 1996 and 1997 are not exactly comparable.
Sources:
- U.S. Department of Commerce, Bureau of Economic Analysis, regional accounts data, http://www.bea.doc.gov/bea/regional/data.htm
Related 2002 Milestones indicator:
Local data:


Milestones is a product of the Minnesota State Demographic Center, a division of the Department of Administration