


What were things like in 2002?
The following idicator summary is from the 2002 Minnesota Milestones and does not neccessarily reflect the current data trends.Custom Report:
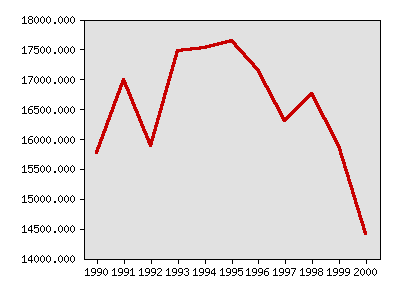
Years of potential life lost to heart disease
| Year | Data |
|---|---|
| Years of potential life lost to heart disease, Minnesota Department of Health | |
| 1990 | 15,765.0 |
| 1991 | 16,987.5 |
| 1992 | 15,877.5 |
| 1993 | 17,475.0 |
| 1994 | 17,530.0 |
| 1995 | 17,637.5 |
| 1996 | 17,150.0 |
| 1997 | 16,307.5 |
| 1998 | 16,760.0 |
| 1999 | 15,887.5 |
| 2000 | 14,402.5 |
Local data:


Milestones is a product of the Minnesota State Demographic Center, a division of the Department of Administration