


Indicator 23: Homicide Rate


Goal: Our communities will be safe, friendly and caring.
Rationale: Minnesotans want to be comfortable and safe in their communities. Crime rates are an important aspect of community safety. Murders are considered the single most serious type of crime.
About this indicator: Between 2000 and 2009 the homicide rate declined slightly from 2.9 to 1.8 per 100,000.
Homicide rate per 100,000
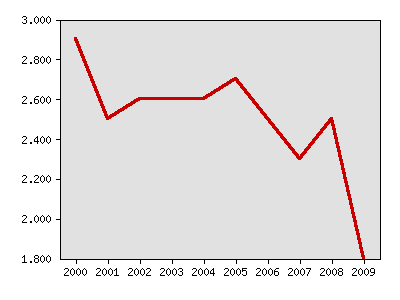
| Year | Data |
|---|---|
| Homicide rate per 100,000, Minnesota Department of Health | |
| 2000 | 2.9 |
| 2001 | 2.5 |
| 2002 | 2.6 |
| 2003 | 2.6 |
| 2004 | 2.6 |
| 2005 | 2.7 |
| 2006 | 2.5 |
| 2007 | 2.3 |
| 2008 | 2.5 |
| 2009 | 1.8 |
For comparison: Department of Justice Statistics show Minnesota had the 11th lowest homicide rate in 2007. According to data compiled by the Death Penalty Information Center, Minnesota had the 6th lowest homicide rate in 2009.
Sources:
- Minnesota Department of Health http://www.health.state.mn.us/divs/chs/annsum/index.htm
- U.S. Census Bureau population estimates http://www.census.gov/
- U.S. Census Bureau, the 2009 Statistical Abstract http://www.census.gov/compendia/statab/cats/law_enforcement_courts_prisons/crimes_and_crime_rates.html
- Death Penalty Information Center, http://www.deathpenaltyinfo.org/home
Local data:


Milestones is a product of the Minnesota State Demographic Center, a division of the Department of Administration