


Indicator 32: Commute Times


Goal: Government in Minnesota will be cost-efficient, and services will be designed to meet the needs of the people who use them.
Rationale: The adequacy of the states transportation system affects residents daily. Traffic congestion is inconvenient for commuters and adversely affects businesses that depend on timely delivery of goods and services.
About this indicator: The average commute time to work in 2009 was 22.5 minutes, not significantly different than the 22.6 minutes in the 2008.
Mean travel time to work (minutes)
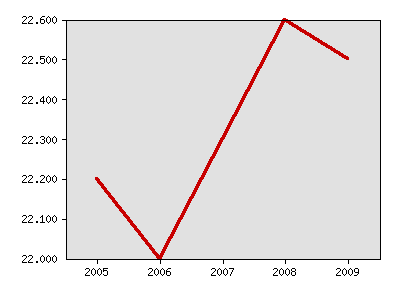
| Year | Data |
|---|---|
| Mean travel time to work (minutes), U.S. Census Bureau | |
| 2005 | 22.2 |
| 2006 | 22 |
| 2007 | 22.3 |
| 2008 | 22.6 |
| 2009 | 22.5 |
For comparison: In the 2000 Census, the average travel time to work was 21.9 minutes. In 1990, it was 19.1 minutes.
In the 2009 American Community Survey, the national average was 25.1 minutes. Minnesota had the 17th lowest average commuting time.
Things to think about: Commuting times reflect more than the presence or absence of congestion. Where people live relative to their place of employment is another important factor. Many Minnesotans are willing to trade a longer commute for less expensive housing or a desired lifestyle.
Sources:
- U.S. Bureau of the Census, American Community Survey, American FactFinder, http://factfinder.census.gov/home/saff/main.html, Economic profiles.
Local data:


Milestones is a product of the Minnesota State Demographic Center, a division of the Department of Administration