


What were things like in 2002?
The following idicator summary is from the 2002 Minnesota Milestones and does not neccessarily reflect the current data trends.Custom Report:
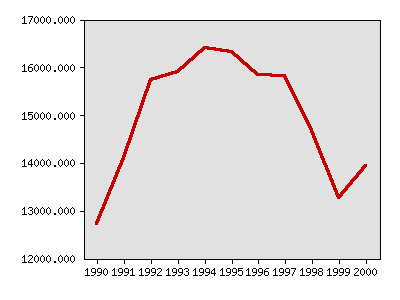
Violent crimes reported
| Year | Data |
|---|---|
| Violent crimes reported, Minnesota Department of Public Safety | |
| 1990 | 12,717 |
| 1991 | 14,109 |
| 1992 | 15,728 |
| 1993 | 15,900 |
| 1994 | 16,404 |
| 1995 | 16,324 |
| 1996 | 15,839 |
| 1997 | 15,818 |
| 1998 | 14,668 |
| 1999 | 13,260 |
| 2000 | 13,937 |


Milestones is a product of the Minnesota State Demographic Center, a division of the Department of Administration