This Web-based document was archived by the Minnesota Legislative Reference Library.
Minnesota Milestones 2010: Obesity
 
 
How is Minnesota doing?
Keep an eye out for these images to quickly tell which way the trend is going:
Thumbs down
Undesirable or negative
Thumbs maybe
No change, or not enough data to draw conclusions
Thumbs up
Desirable or positive.
login

Indicator 16: Obesity

Thumbs downimage
Goal: Minnesotans will be healthy.
Rationale: Growing rates of obesity have become a major source of concern in public health circles. Obesity is a major risk factor for heart disease, diabetes and other ailments.
About this indicator: Obesity rates have increased substantially in Minnesota. In 1995, 15.3 percent of Minnesotans were classified as obese. By 2009 the rate was 25.4 percent. Obesity is defined as a body mass index of 30.0 or more.
graph
Confidence Interval (high) of percent of population defined as obese
YearData
Percent of population defined as obese, Behavioral Risk Factor Surveillance System Edit trend | Edit data
Confidence Interval (low) of percent of population defined as obese, Risk Factor Surveillance System Edit trend | Edit data
Confidence Interval (high) of percent of population defined as obese, Risk Factor Surveillance System Edit trend | Edit data
Obesity Confidence Interval low Confidence Interval high
199515.3% 14.0 16.6
199614.3% 13.1 15.5
199716.5% 15.3 17.7
199816.2% 15.0 17.4
199915.5% 14.4 16.6
200017.4% 15.8 19.0
200119.9% 18.5 21.3
200222.4% 21.0 23.8
200323% 21.5 24.5
200422.6% 21.2 24.0
200523.7% 21.8 25.6
200624.7% 23.0 26.4
200726% 24.2 27.8
200825.2% 23.5 26.8
200925.4% 23.7 27
         Select data sets for individual graphing:
Create merged graph of all datasets
Create merged graph of selected datasets

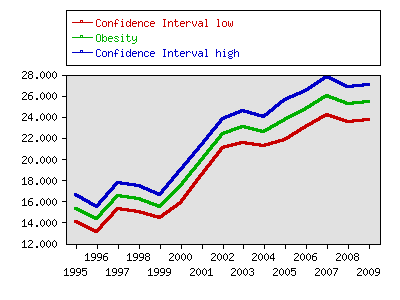
For comparison: Minnesota is similar to the national average. Nationally, 26.9 percent of the population was classified as obese in 2009.
Sources:
Local data:

Milestones is a product of the Minnesota State Demographic Center, a division of the Department of Administration